ON–065: Layer 1s
Coverage on Solana, Celo, Ethereum, and Bitcoin.
Apr 2, 2021

This is issue #65 of the on-chain analytics newsletter that reaches nearly 10k crypto investors every week 📈
About the editor: Spencer Noon is an investor at Variant, a first-check crypto VC fund.

1inch, whose v2 offers the best rates by discovering the most efficient swapping routes across all DEXes—swap on the customizable new UI. And also Aave, where you can experience DeFi: Deposit, Earn, & Borrow on Aave.
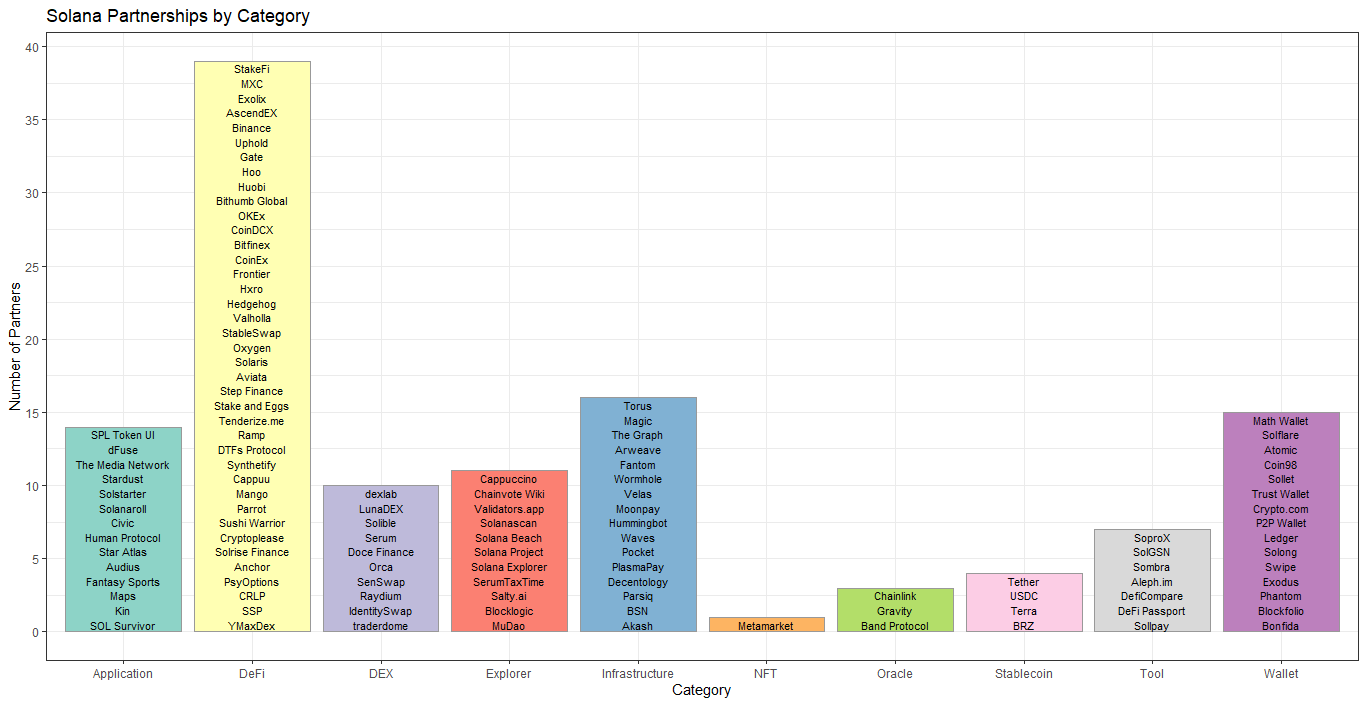
- The Solana network uses an innovative Proof-of-History consensus algorithm to solve the commonly cited blockchain scalability, decentralization and security trilemma. Their multi-year efforts have culminated into a network that supports 65,000 transactions per second across blocks generated every 400ms, all facilitated by an interconnected node cluster of 566 validators. As adoption has increased, an ecosystem of over 120 partners has formed around the network to support everything from NFTs to Oracle services.
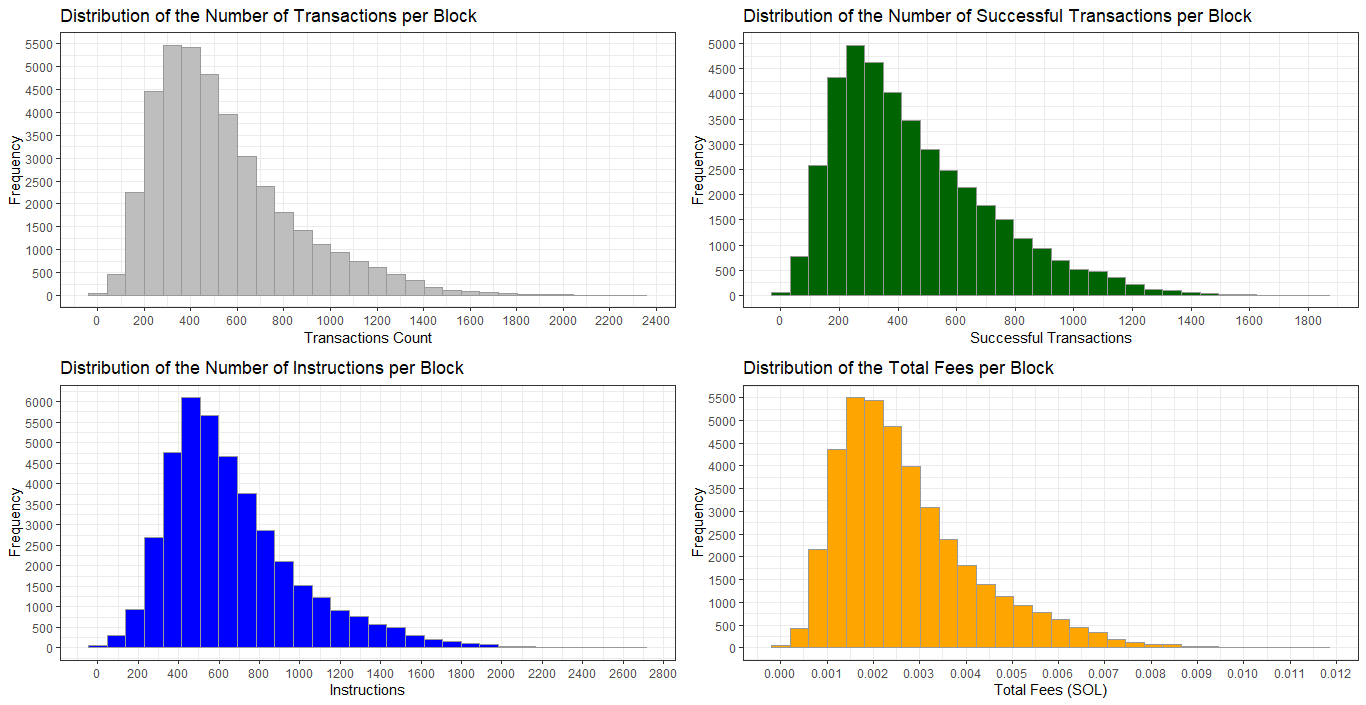
- Using a 24 hour data pull from the Solana Beach Block Explorer, in this period, their blockchain maxed out at 2323 transactions in one block. The average block had a success rate of over 80%, included 1.1 instructions per transaction and generated .00274 SOL in fees.
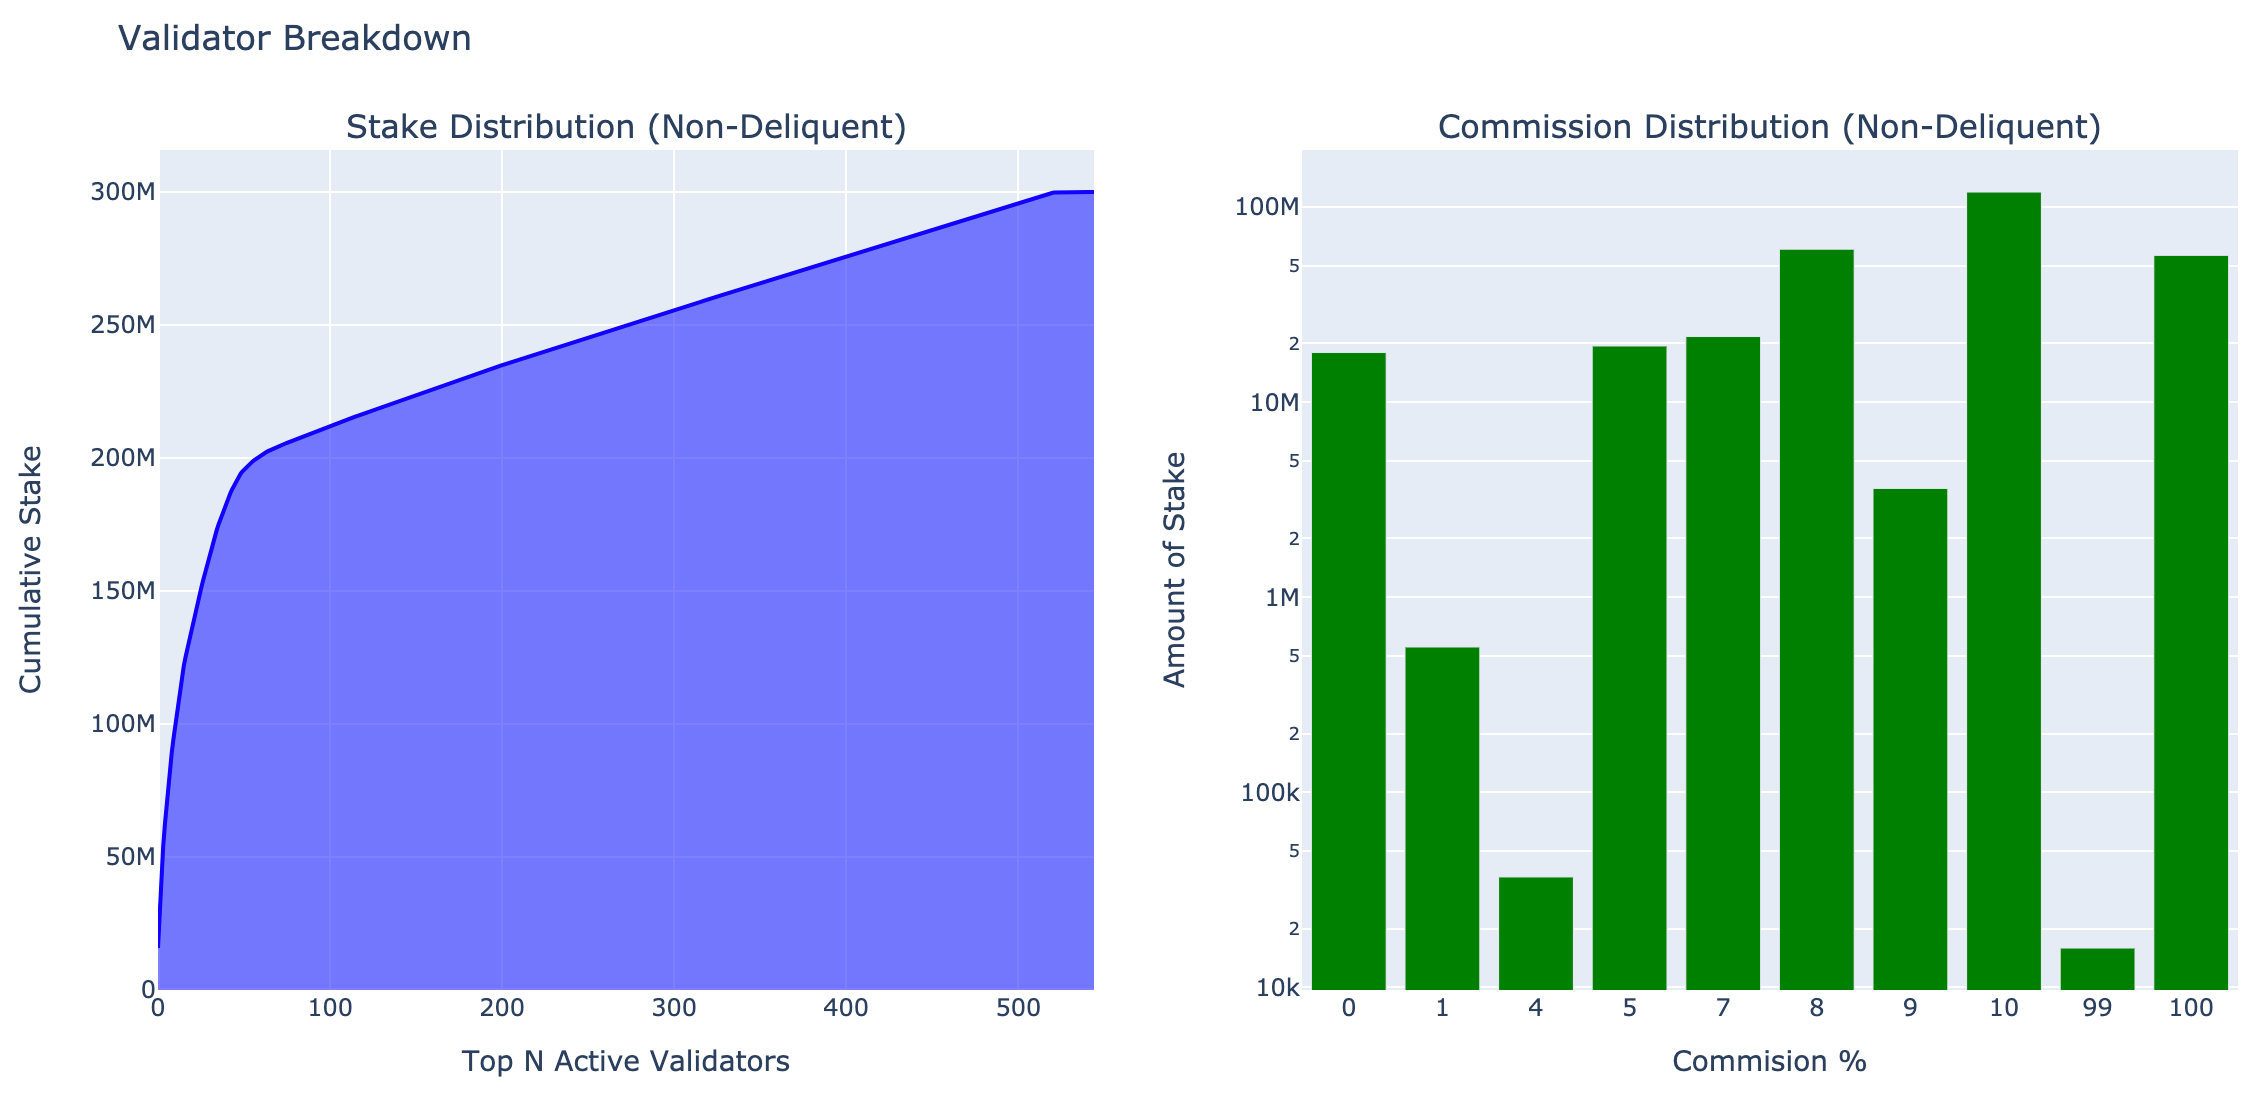
- Total stake on Solana has reached 300M SOL. At the current price of $19.10 this equals ~$5.7B staked. Solana staking is seemingly well distributed — The top 20 validators account for 130M SOL, but after that, the validator share is fairly evenly distributed among the remaining 546 addresses. Validators can set a “commission” as the % of rewards kept by the voter. 56M of stake is set at a 100% commission and 18M at zero. The vast majority of stake is concentrated at a 5-10% commission for the validator.
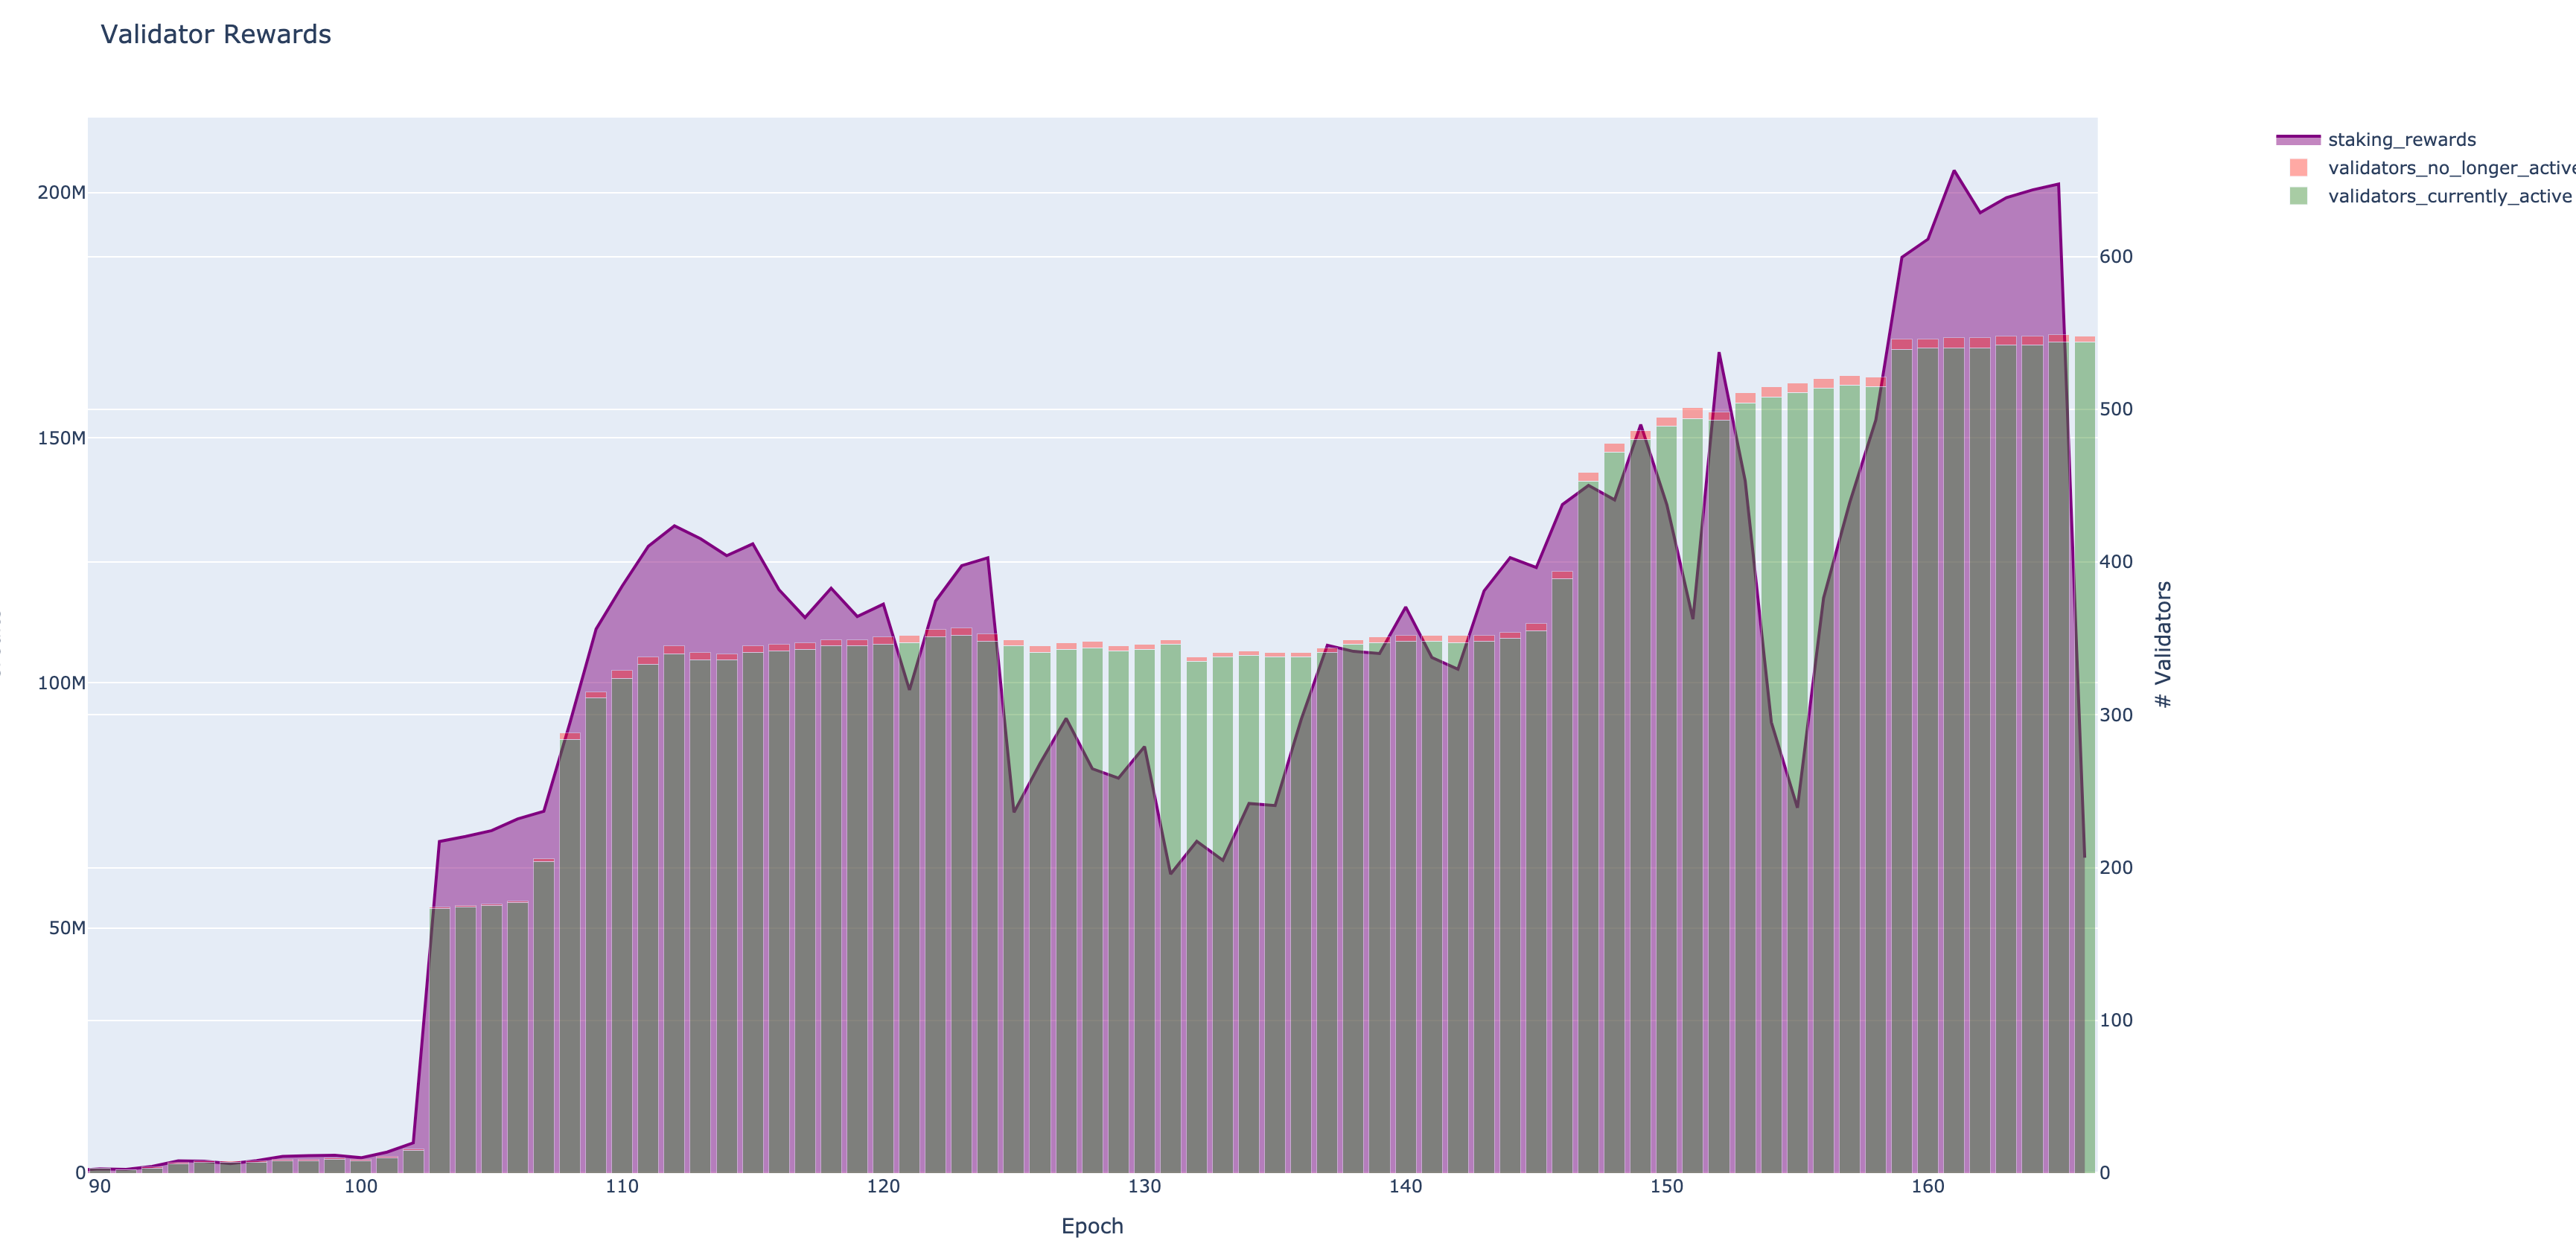
- Most validators are not “delinquent” — After epoch 102 staking rewards and # of validators started to kick-off. Staking rewards continue to grow, now up 201M credits in epoch 165 (with some dips). The number of validators has grown to 566, with most validators staying “current” and continuing to stake.
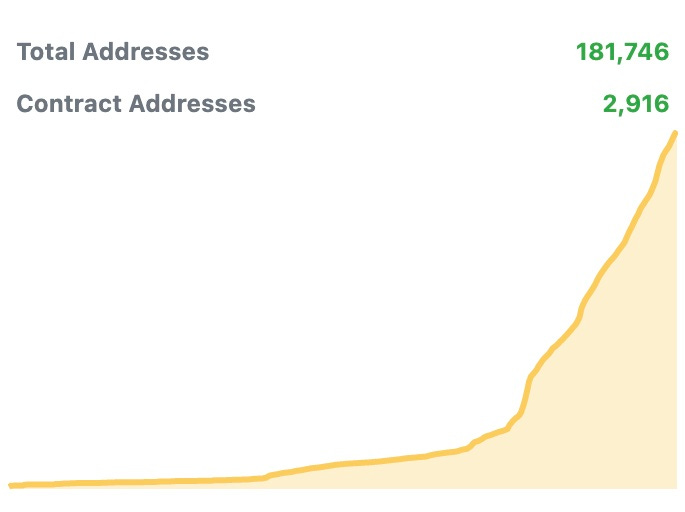
- The number of addresses grew 600% to 181,000 in Q1 2021. Part of the growth seems to be driven by impactMarket, a mobile-first Universal Basic Income dApp that gives $0.53/day to those in need. Today 13,000 beneficiaries across 64 communities are receiving cUSD, making it one of the largest UBI projects in the world. Data suggests beneficiaries are then staying in the Celo ecosystem because they can earn rewards and pay local merchants. If you like this project consider donating to impactmarket.com.
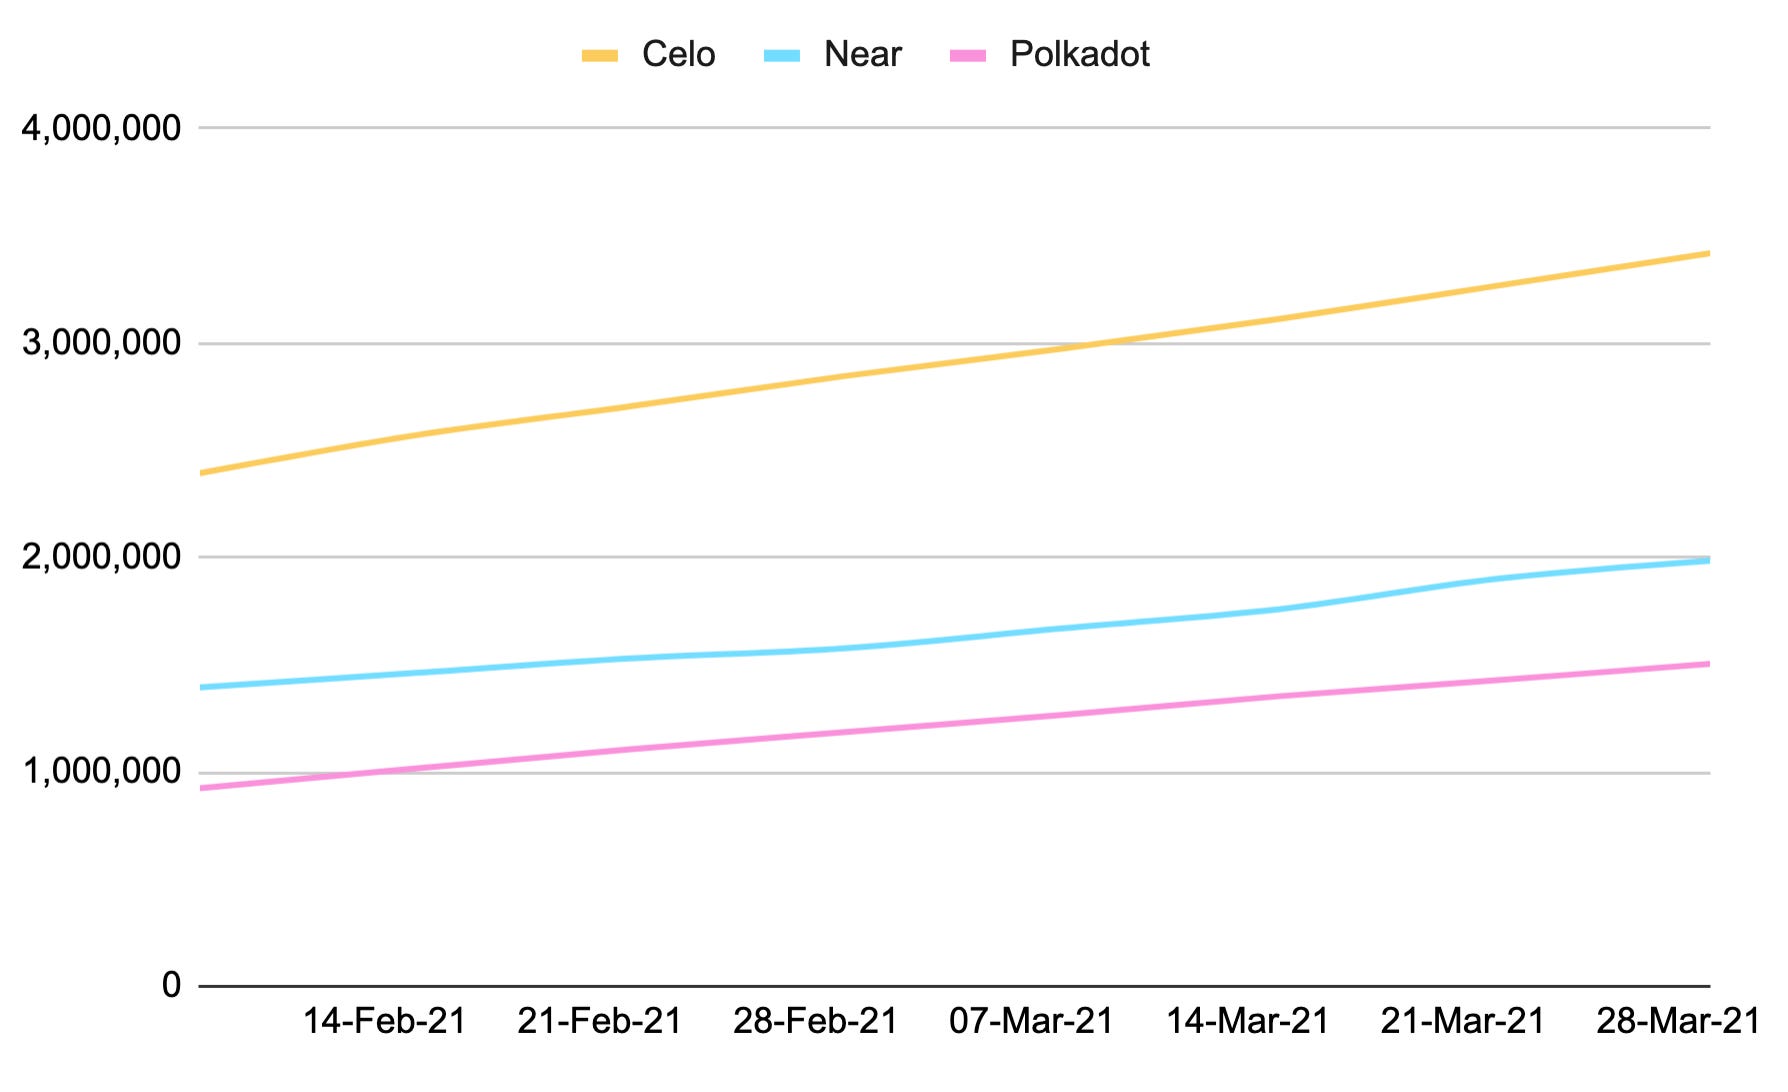
- The number of transactions on Celo grew 300% from 6,800 to 31,600 in Q1 2021 totaling ~3.5m transactions over the past year, which is more than Polkadot and NEAR combined. The activity appears to be driven by 132 active developers building projects on Celo.
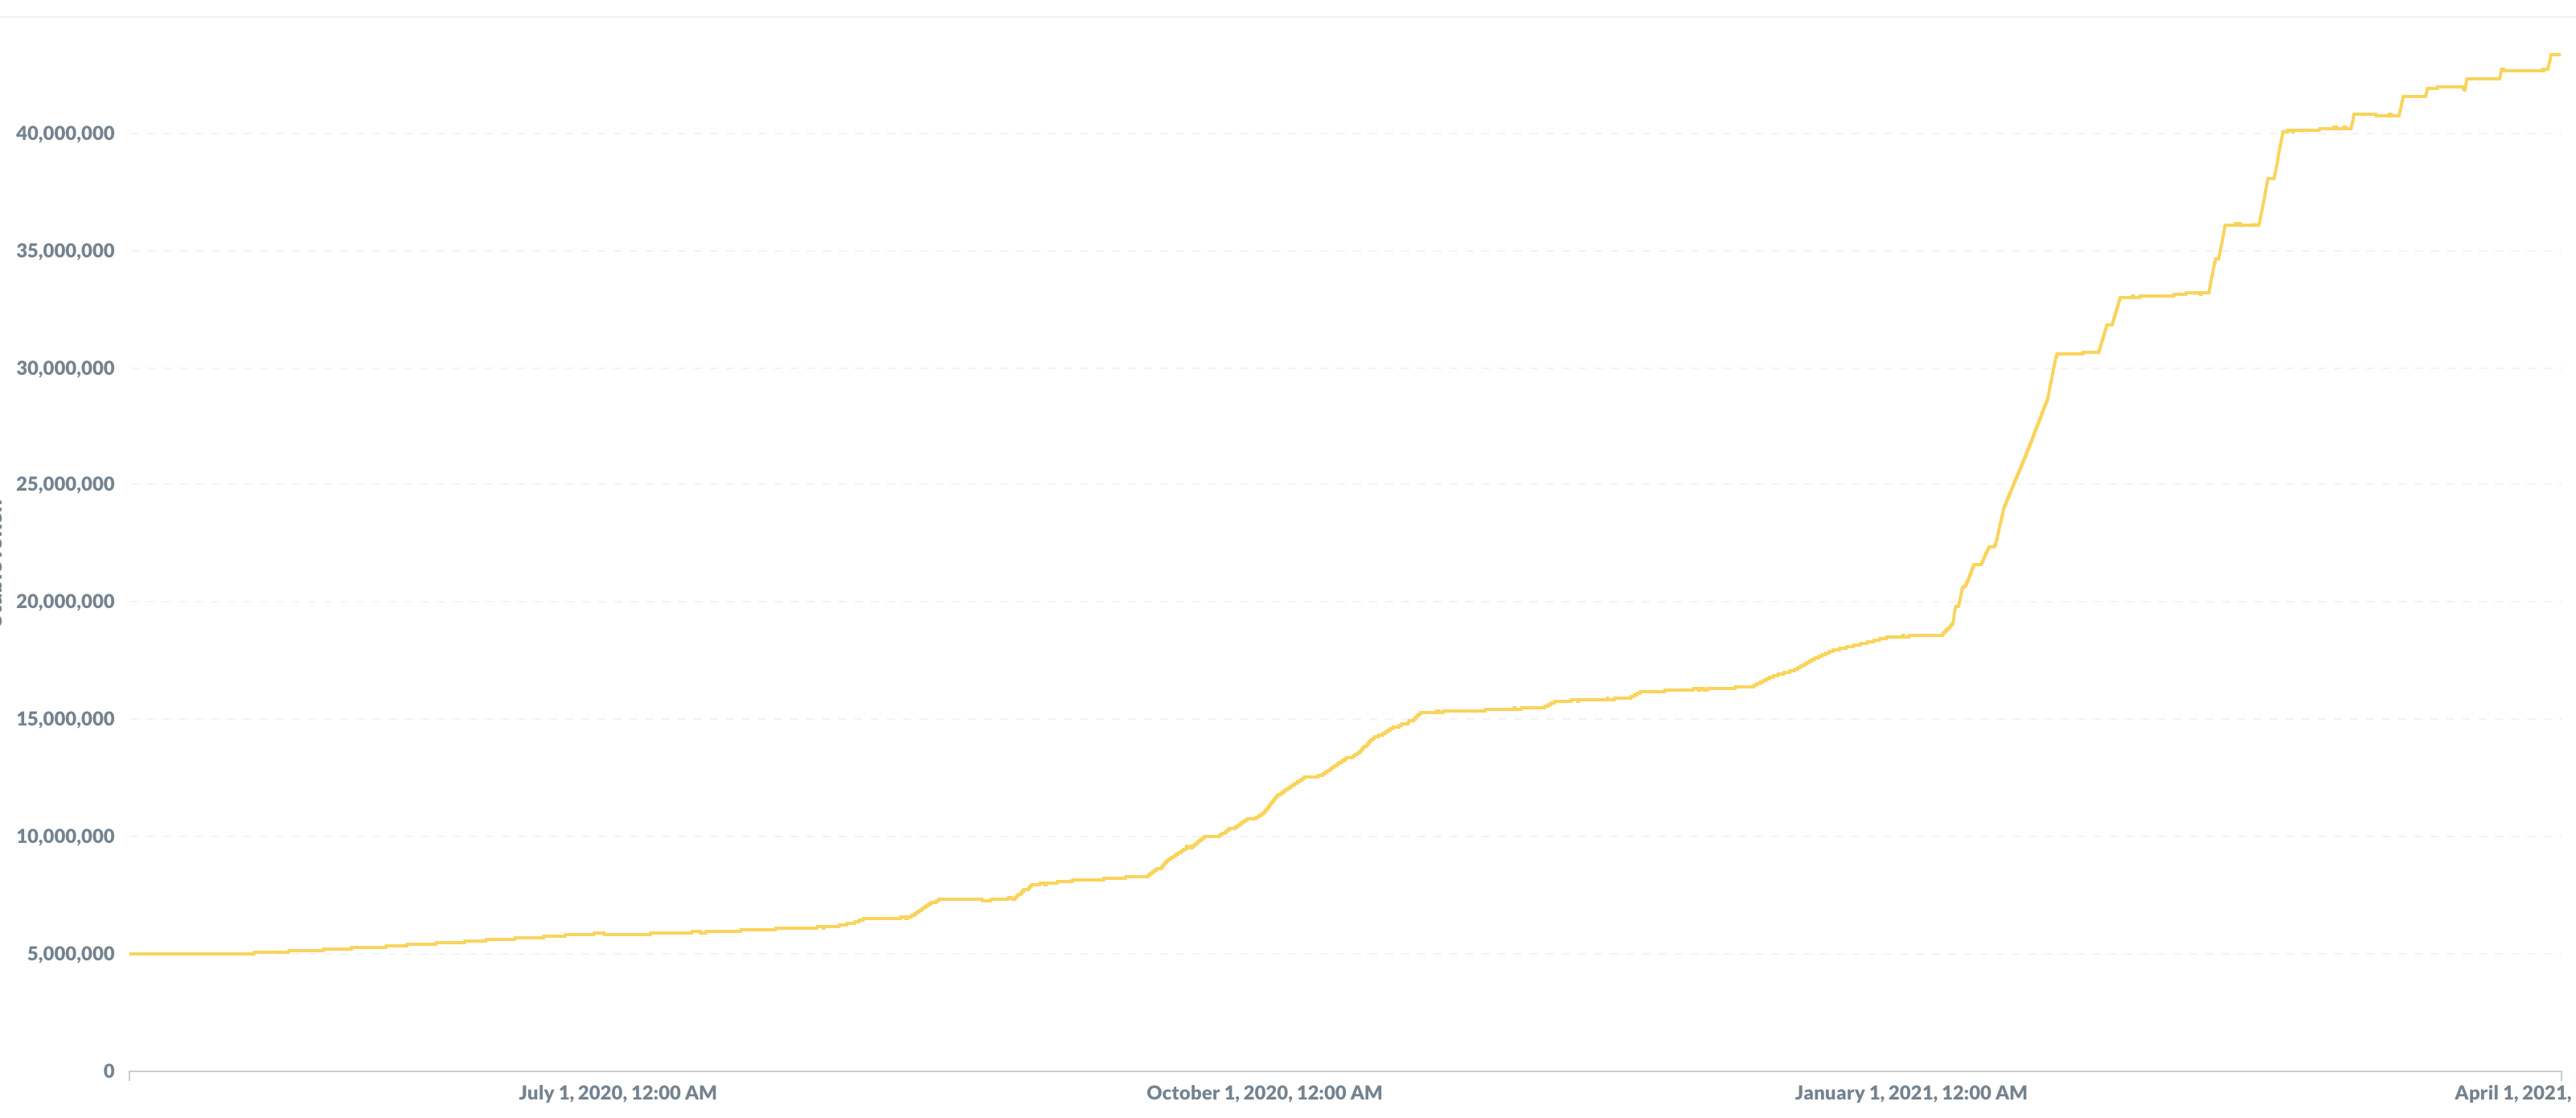
- The amount of cUSD on the network grew >250% from 15m to 43m in Q1 2021. It’s backed by $670m worth of crypto assets (CELO, BTC, ETH, DAI) corresponding to a 1595% ratio. Since mainnet launch cUSD consistently maintained its algorithmically-stabilized value, deviating no more than 0.8% from 1 USD.
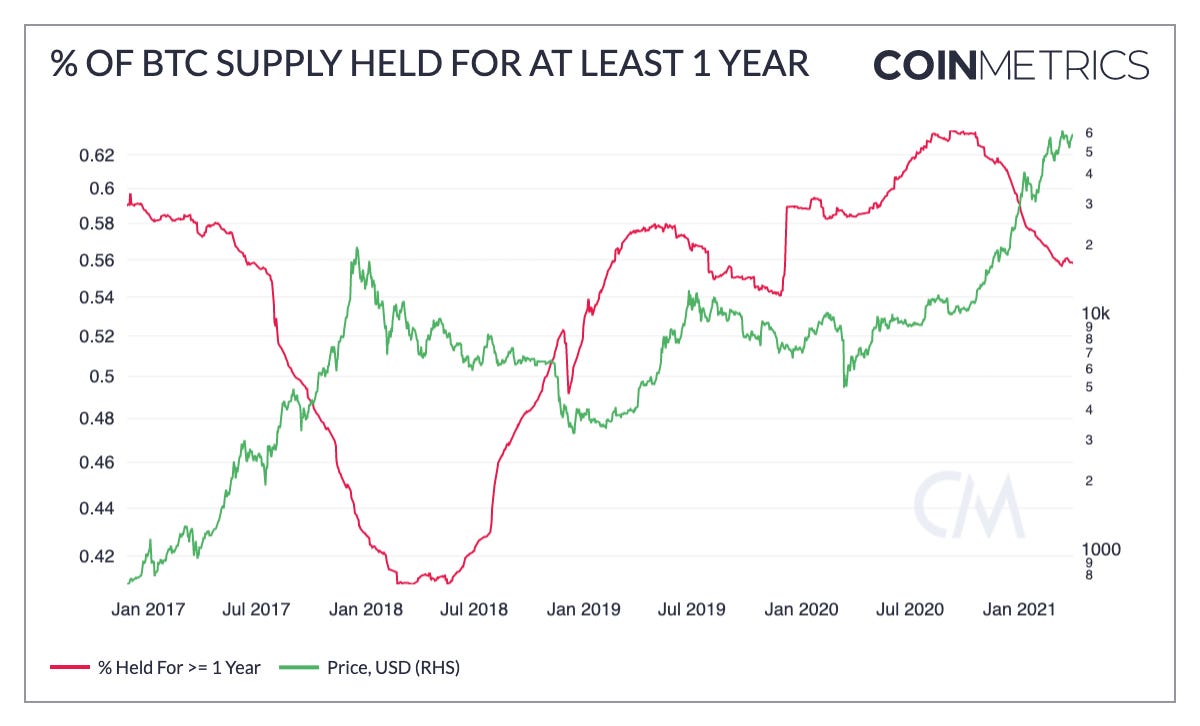
- After growing throughout 2020, the percent of BTC supply held for at least a year has dropped from 59% to 55% in 2021. During rapid price increases this metric tends to decline as long-term holders move to sell their BTC — but something interesting happened on March 12th, 2021: the percent of BTC held for at least a year started to increase again. A year to the day after the March 2020 crash, this increase indicates that many who bought BTC in the wake of the crash have been holding ever since.
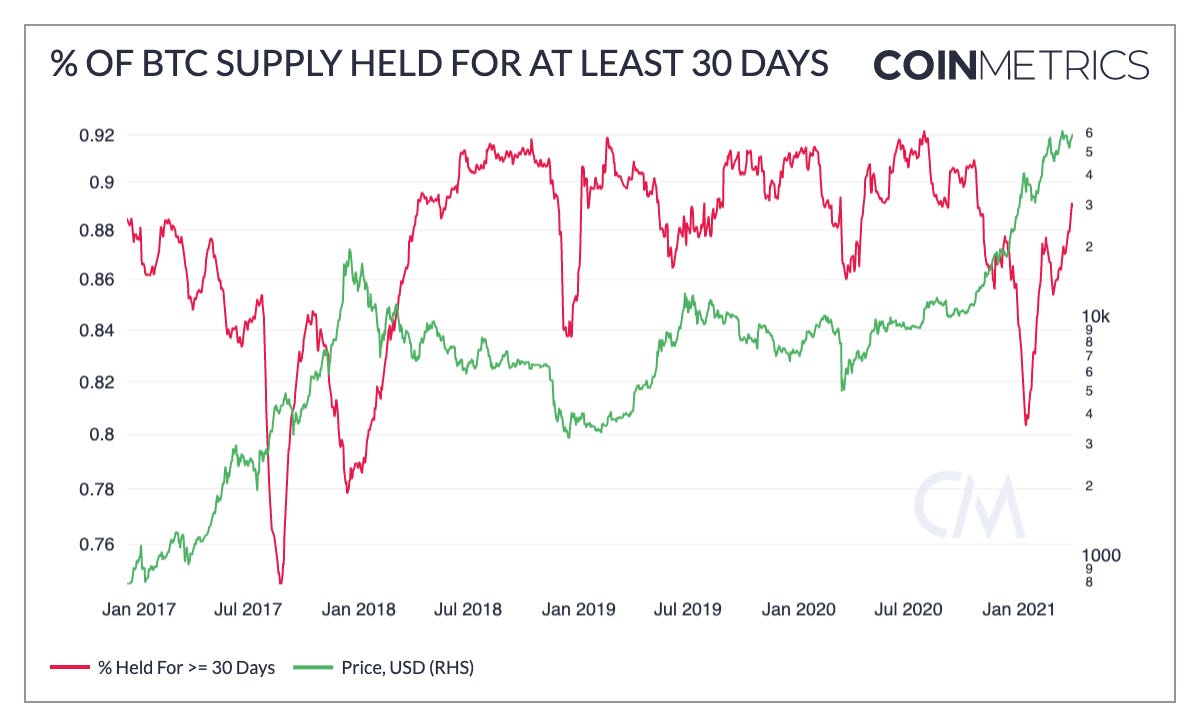
- The percent of BTC held for at least 30 days also declined to start the year. Historically this metric drops during periods of market frenzy, like Aug. 2017 and Jan. 2018; However, after falling to a two-year low of 80%, it has since rebounded to 89%, another sign of increased holding going into Q2.
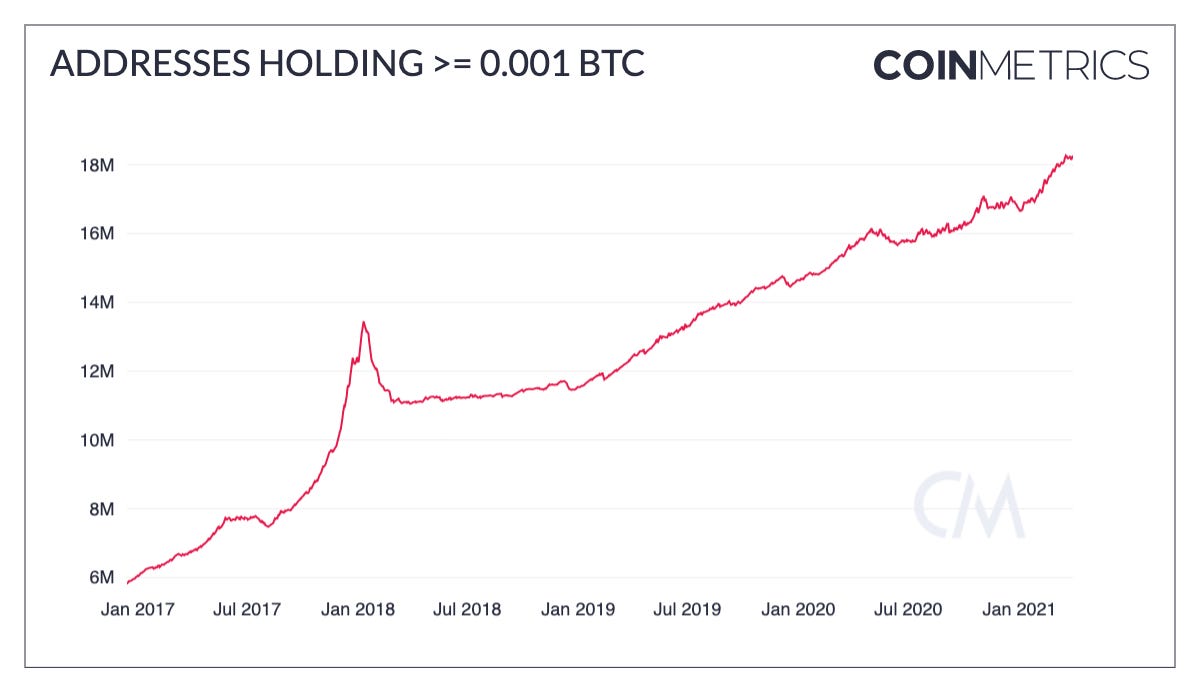
- The number of addresses holding BTC is increasing at a relatively fast rate in 2021. The number of addresses holding at least 0.001 BTC has grown from 16.69M on Jan. 1st to 18.26M on Mar. 31st, a gain of 1.57M addresses. For context, the number of addresses holding at least 0.001 BTC grew by 2.07M in 2020.
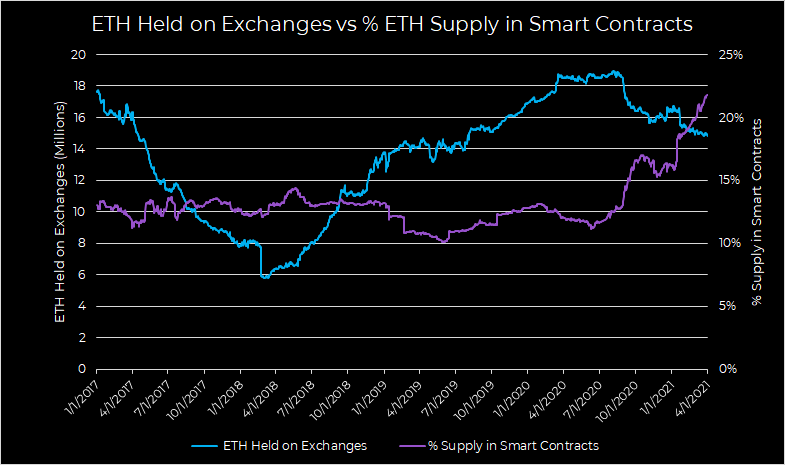
- The exodus of ETH from centralized exchanges continues with a 27% drawdown and counting since late August. With the % ETH supply in smart contracts rising to 22%, utility of ETH is demonstrated as it’s being used across various functions within DeFi — currently with a TVL of 9.7m ETH driven by Maker (with 2.9m ETH) and Compound (with 1.8m ETH). (Source: DeFi Pulse).
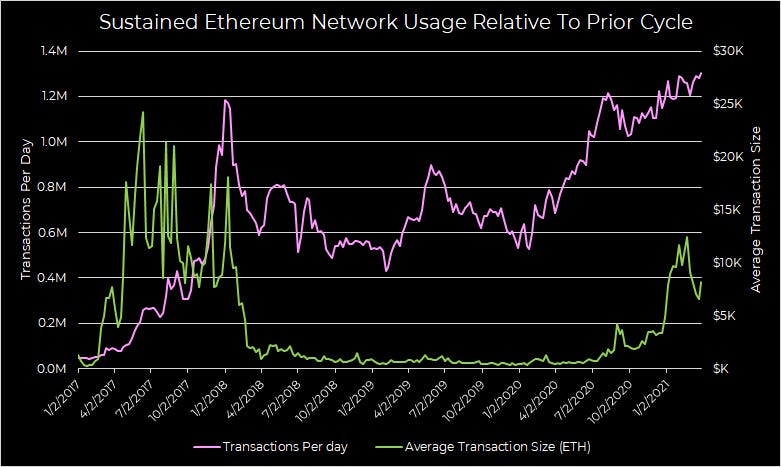
- Network usage exhibits healthy growth as demonstrated by a steady increase over time in transactions per day to a recent ATH of 1.3 million transactions. Lower avg. transaction sizes indicate broader utility in Ethereum and more retail participation, vs the short-lived and whale driven ’17 cycle.
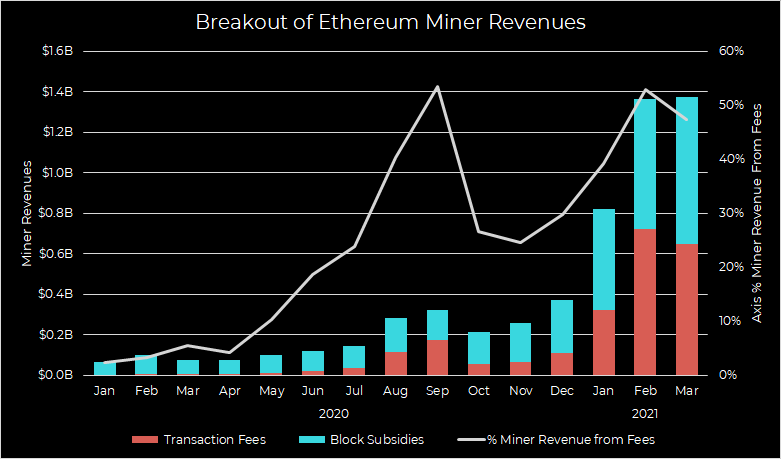
- In March, 47% of miners’ revenues came from transaction fees, which were down 10% M/M to $648m. Although fees are healthy for long term sustainability, Ethereum is overpaying for security at the expense of users. EIP-1559 (ETA July) brings deflationary pressures as base fees will be burned.