ON–012: DeFi
Mar 12, 2020

Welcome to Issue #12 of Our Network, a weekly newsletter where top blockchain projects and communities share data-driven insights and advanced metrics.
This week our contributors deliver a DeFi mega-update:
- Chainlink 🆕
- Lending rates 🆕
- Nexus Mutual
- Stablecoins
- PoolTogether
- Kyber Network
Contributors: ChainLinkGod and CryptoSponge
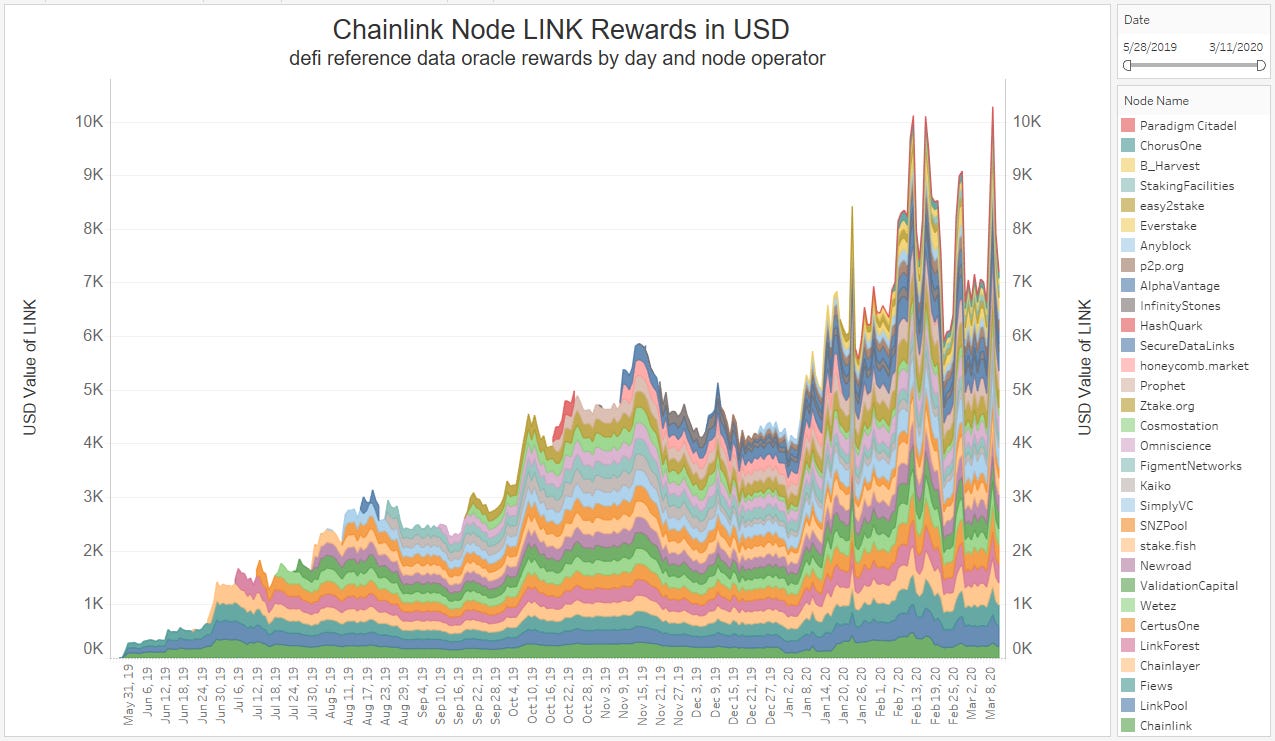
Economic activity of Chainlink oracle networks in aggregate has been steadily increasing since mainnet launch on May 30th, 2019. This is due to a combination of fluctuations in the price of the ERC677 token LINK (used to request data from nodes), an increase in active nodes, and an expanding array of oracle networks.
In total, node payments have increased from $400 of LINK per day to approximately $7,000 of LINK per day, a growth of 17.5x. Active node count has increased from three to 31, a growth of 10.33x. Payments per day have become more volatile as oracle networks can update on a static schedule (e.g. hourly, daily) and/or now a deviation based schedule (e.g. 1% deviation since last update). This chart shows the LINK payments to each node per day, multiplied by the LINK/USD close price each day.
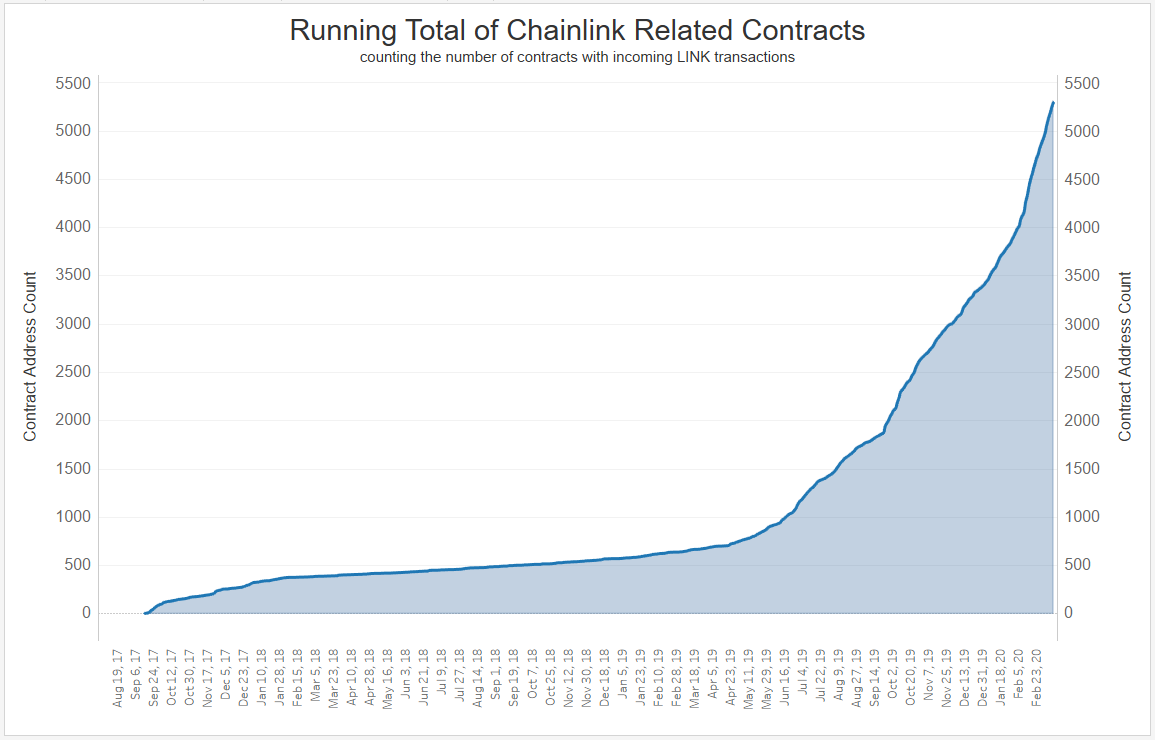
The below chart shows the cumulative number of contracts that have interacted with the LINK token and starts at the token sale in September 2017. From then, the number of Chainlink-related contracts grew until January 2018 when the overall crypto markets turned over. Growth in contracts stagnated between 400 and 700 contracts for 15 months (increase of only 1.75x) until just before the launch of mainnet in May 2019 when contract growth hit an inflection point and began to turn vertical.
Since then, the number of contracts has increased from 700 to over 5,300 cumulative contracts, a growth of 7.57x in nine months. Recent growth in this metric can largely be attributed to smart contract developers integrating Chainlink oracle functionality in their decentralized applications.
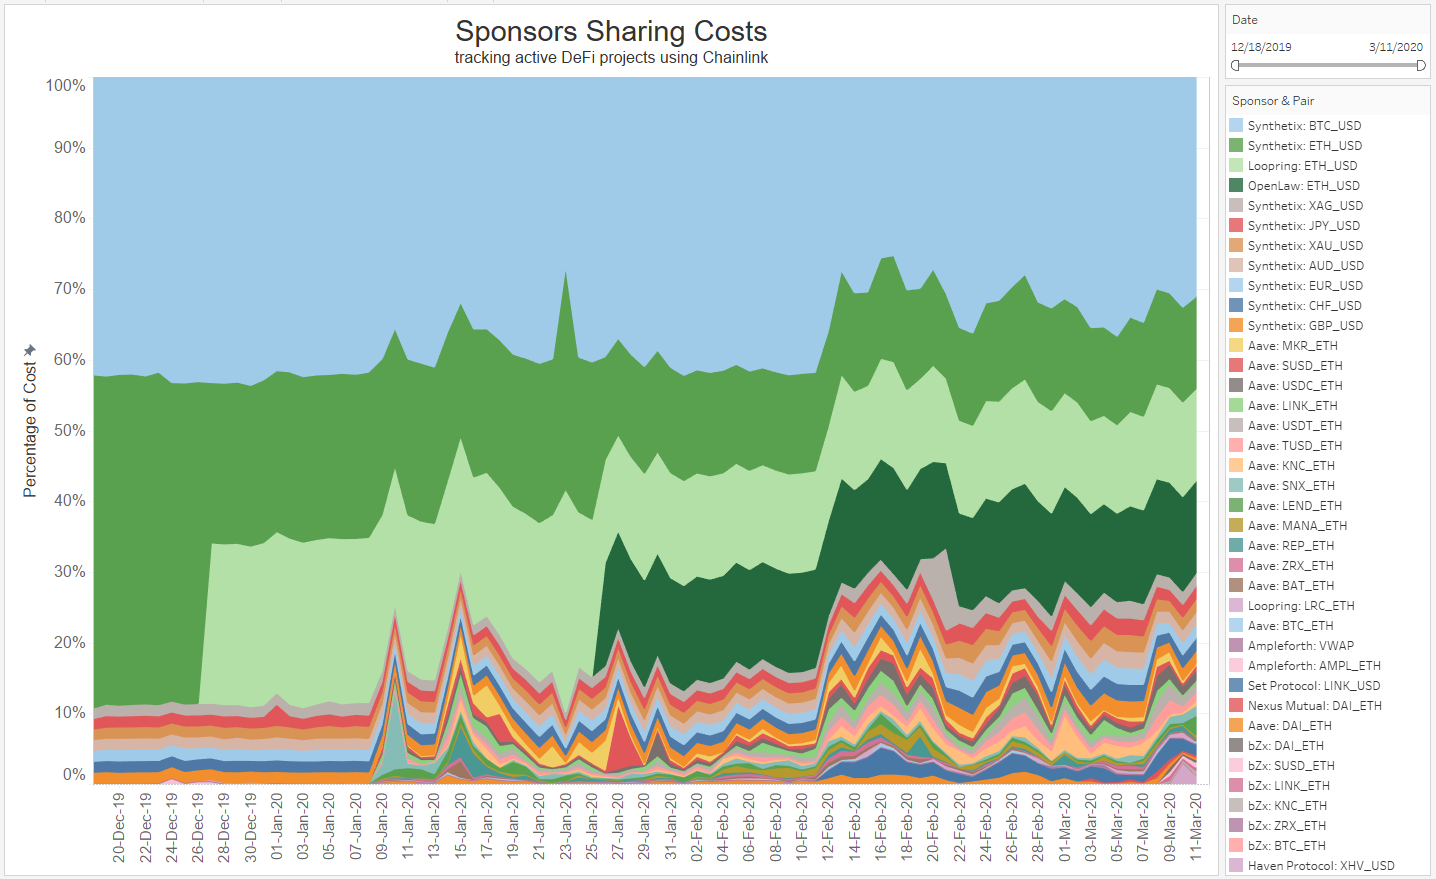
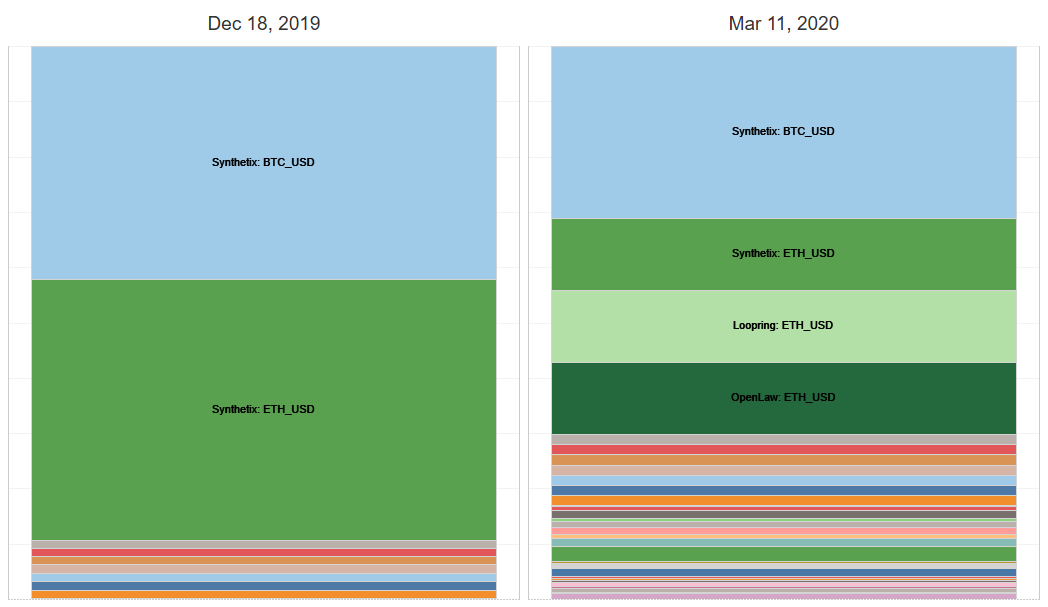
The diversity of price feeds live on mainnet and their respective sponsors have expanded from 10 price feeds supported by two projects to now 29 price feeds supported by 10 projects, a growth of 2.9x in price feeds and 5x in sponsors in the past three months. The BTC/USD and ETH/USD price feeds consume such a high percentage of Chainlink’s bandwidth due to its higher relative decentralization (20-21 nodes vs 7-9) and more sensitive update frequency (every 20 minutes and 0.5% deviation).
The ETH/USD price feed has shifted from a single sponsor to three independent sponsors. This reduced the costs experienced by the original sponsor by 66% with no reduction in node payments. As more projects support a common oracle network, the costs for each individual sponsor goes down, creating a public good model where security can be higher than what a single project could reasonably afford on its own.
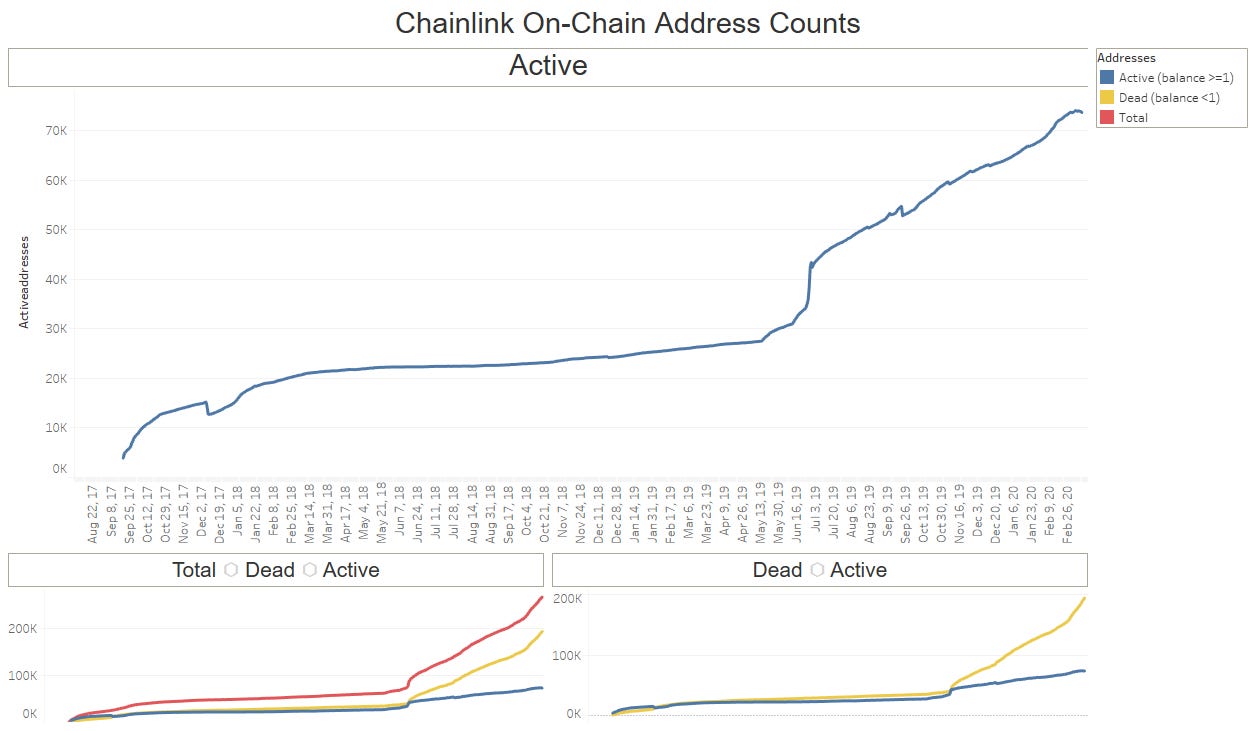
Tracking Ethereum addresses that hold LINK reveals a similar trend to the cumulative contracts graph. After the token sale in September 2017, there were 3,867 addresses that held at least one LINK. After a few months, this grew to 15,262 addresses (increase of 3.94x). In February 2018, active address count hit 20,000 after which growth slowed substantially with only an increase of 1.37x in 15 months to 27,500 addresses.
Growth picked up just before mainnet in May 2019 with an additional boost in June when Coinbase listed LINK. After hitting an inflection point, active addresses have since increased 2.68x in the past nine months. At the time of writing, there are 73,900 active addresses that hold at least 1 LINK, with a total of 268,320 addresses that have ever held the LINK token. From token sale to today, active addresses have increased 19.11x and total addresses increased 69.38x.
Contributor: Lucas Campbell, Growth at DeFi Rate
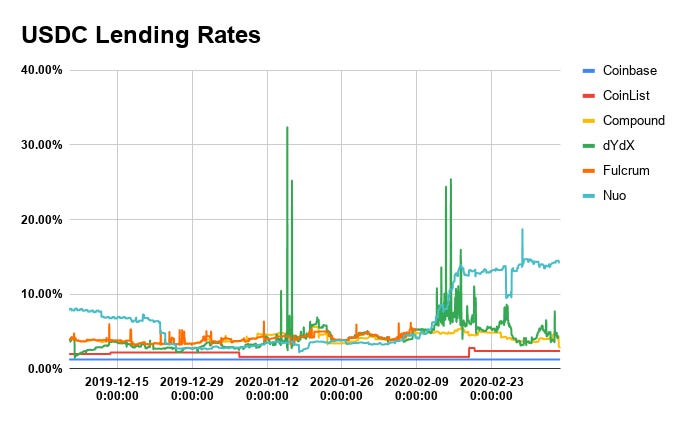
- USDC Lending Rates: In the past 3 months, USDC lending rates have seen a relatively steady increase across the board. Nuo is leading the pack, currently offering 14.25% APR on USDC loans with a 90-Day average of 6.48% in annualized returns. Coinbase, the stablecoin’s issuing entity, offers the lowest rates on the market with a mere 1.25% APR for all Coinbase users. With that, we also see DeFi protocols like Compound and dYdX offering substantially higher rates than Coinbase with a 90-day average of 4.08% and 4.24%, respectively.
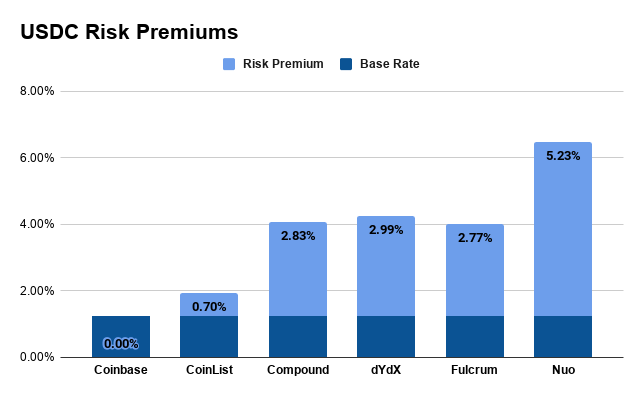
USDC Risk Premium: In traditional finance, the risk premium is calculated by subtracting the expected return by the risk free rate. In the lens of crypto, the “risk free rate” can essentially be seen as the rate of return offered by the stablecoin’s issuing entity while the expected return is the rate offered by a third-party lending platform/protocol. The risk premium is a good measure for the underlying risks associated with the loan as well as the additional incentive for making a deposit into the respective third party lending platform/protocol.
For USDC, the risk free rate is Coinbase’s 1.25%. With that, Nuo has the highest risk premium of 5.23% followed by Fulcrum (2.77%), dYdX (2.99%) and Compound (2.83%). Lastly, CoinList, a centralized crypto bank, offers the second lowest risk premium of only 0.70%.
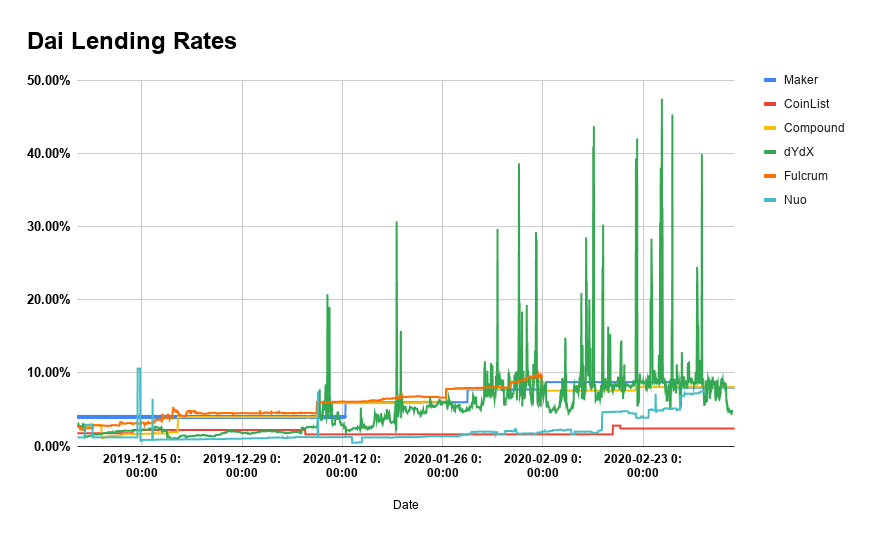
- Dai Lending Rates: Since the launch of the Dai Savings Rate (DSR), Dai interest rates have steadily increased as well. The DSR started off at 4.00% back in November and has incrementally increased to today’s rate of 8.00%. With that, dYdX is offering the highest rate of 11.53% despite the recent drop off in lending rates earlier this month. Interest rates for Fulcrum are 9.54% followed by Compound at 8.09% and Nuo at 7.44%. Finally, CoinList offers the lowest interest rate in the field for Dai of 2.4%.
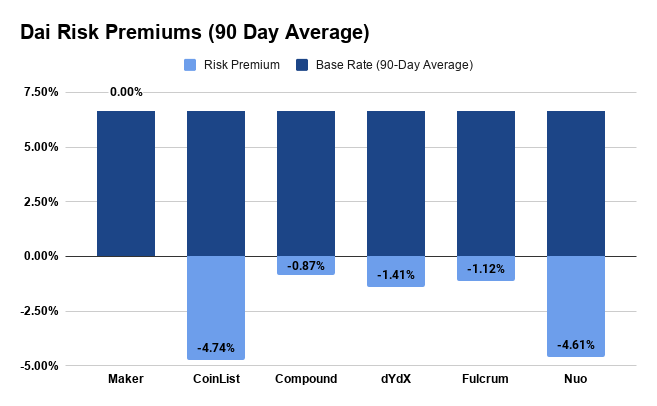
- Dai Risk Premiums (90-Day): The introduction of the DSR established the “risk-free rate” for the Dai lending markets. By looking at the 90 Day average risk premiums, we can actually see that all other platforms offer a negative risk premium, showing the nascency of the DSR and the potential risks associated with the savings contract. However, we can expect that over time the DSR will act as the risk-free rate or the base rate for the market as the DSR is battle-hardened and confidence in the system grows.
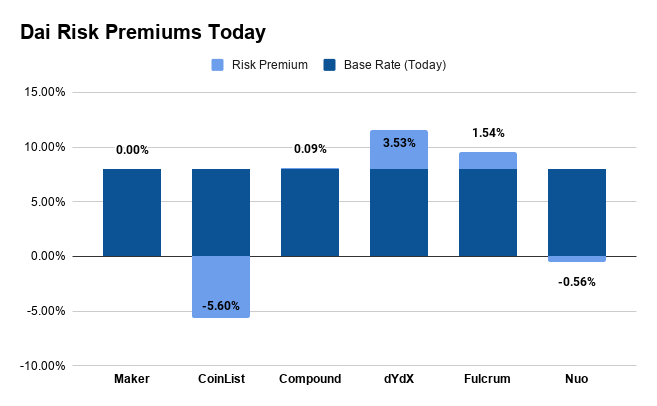
- Dai Risk Premiums (Today): The notion of the DSR as the risk-free rate is becoming more apparent once we take a snapshot of the risk premiums today. Compound, dYdX, and Fulcrum have all factored in a small risk premium of 0.09%, 3.53% and 1.54% respectively. Interestingly, Nuo has a slightly negative risk premium as it only offers 7.44% APR on Dai loans. The only other platform to offer a negative risk premium today is CoinList, showing that users may be more comfortable trusting centralized crypto banks over nascent money protocols.
Contributor: Richard Chen, Partner at 1confirmation
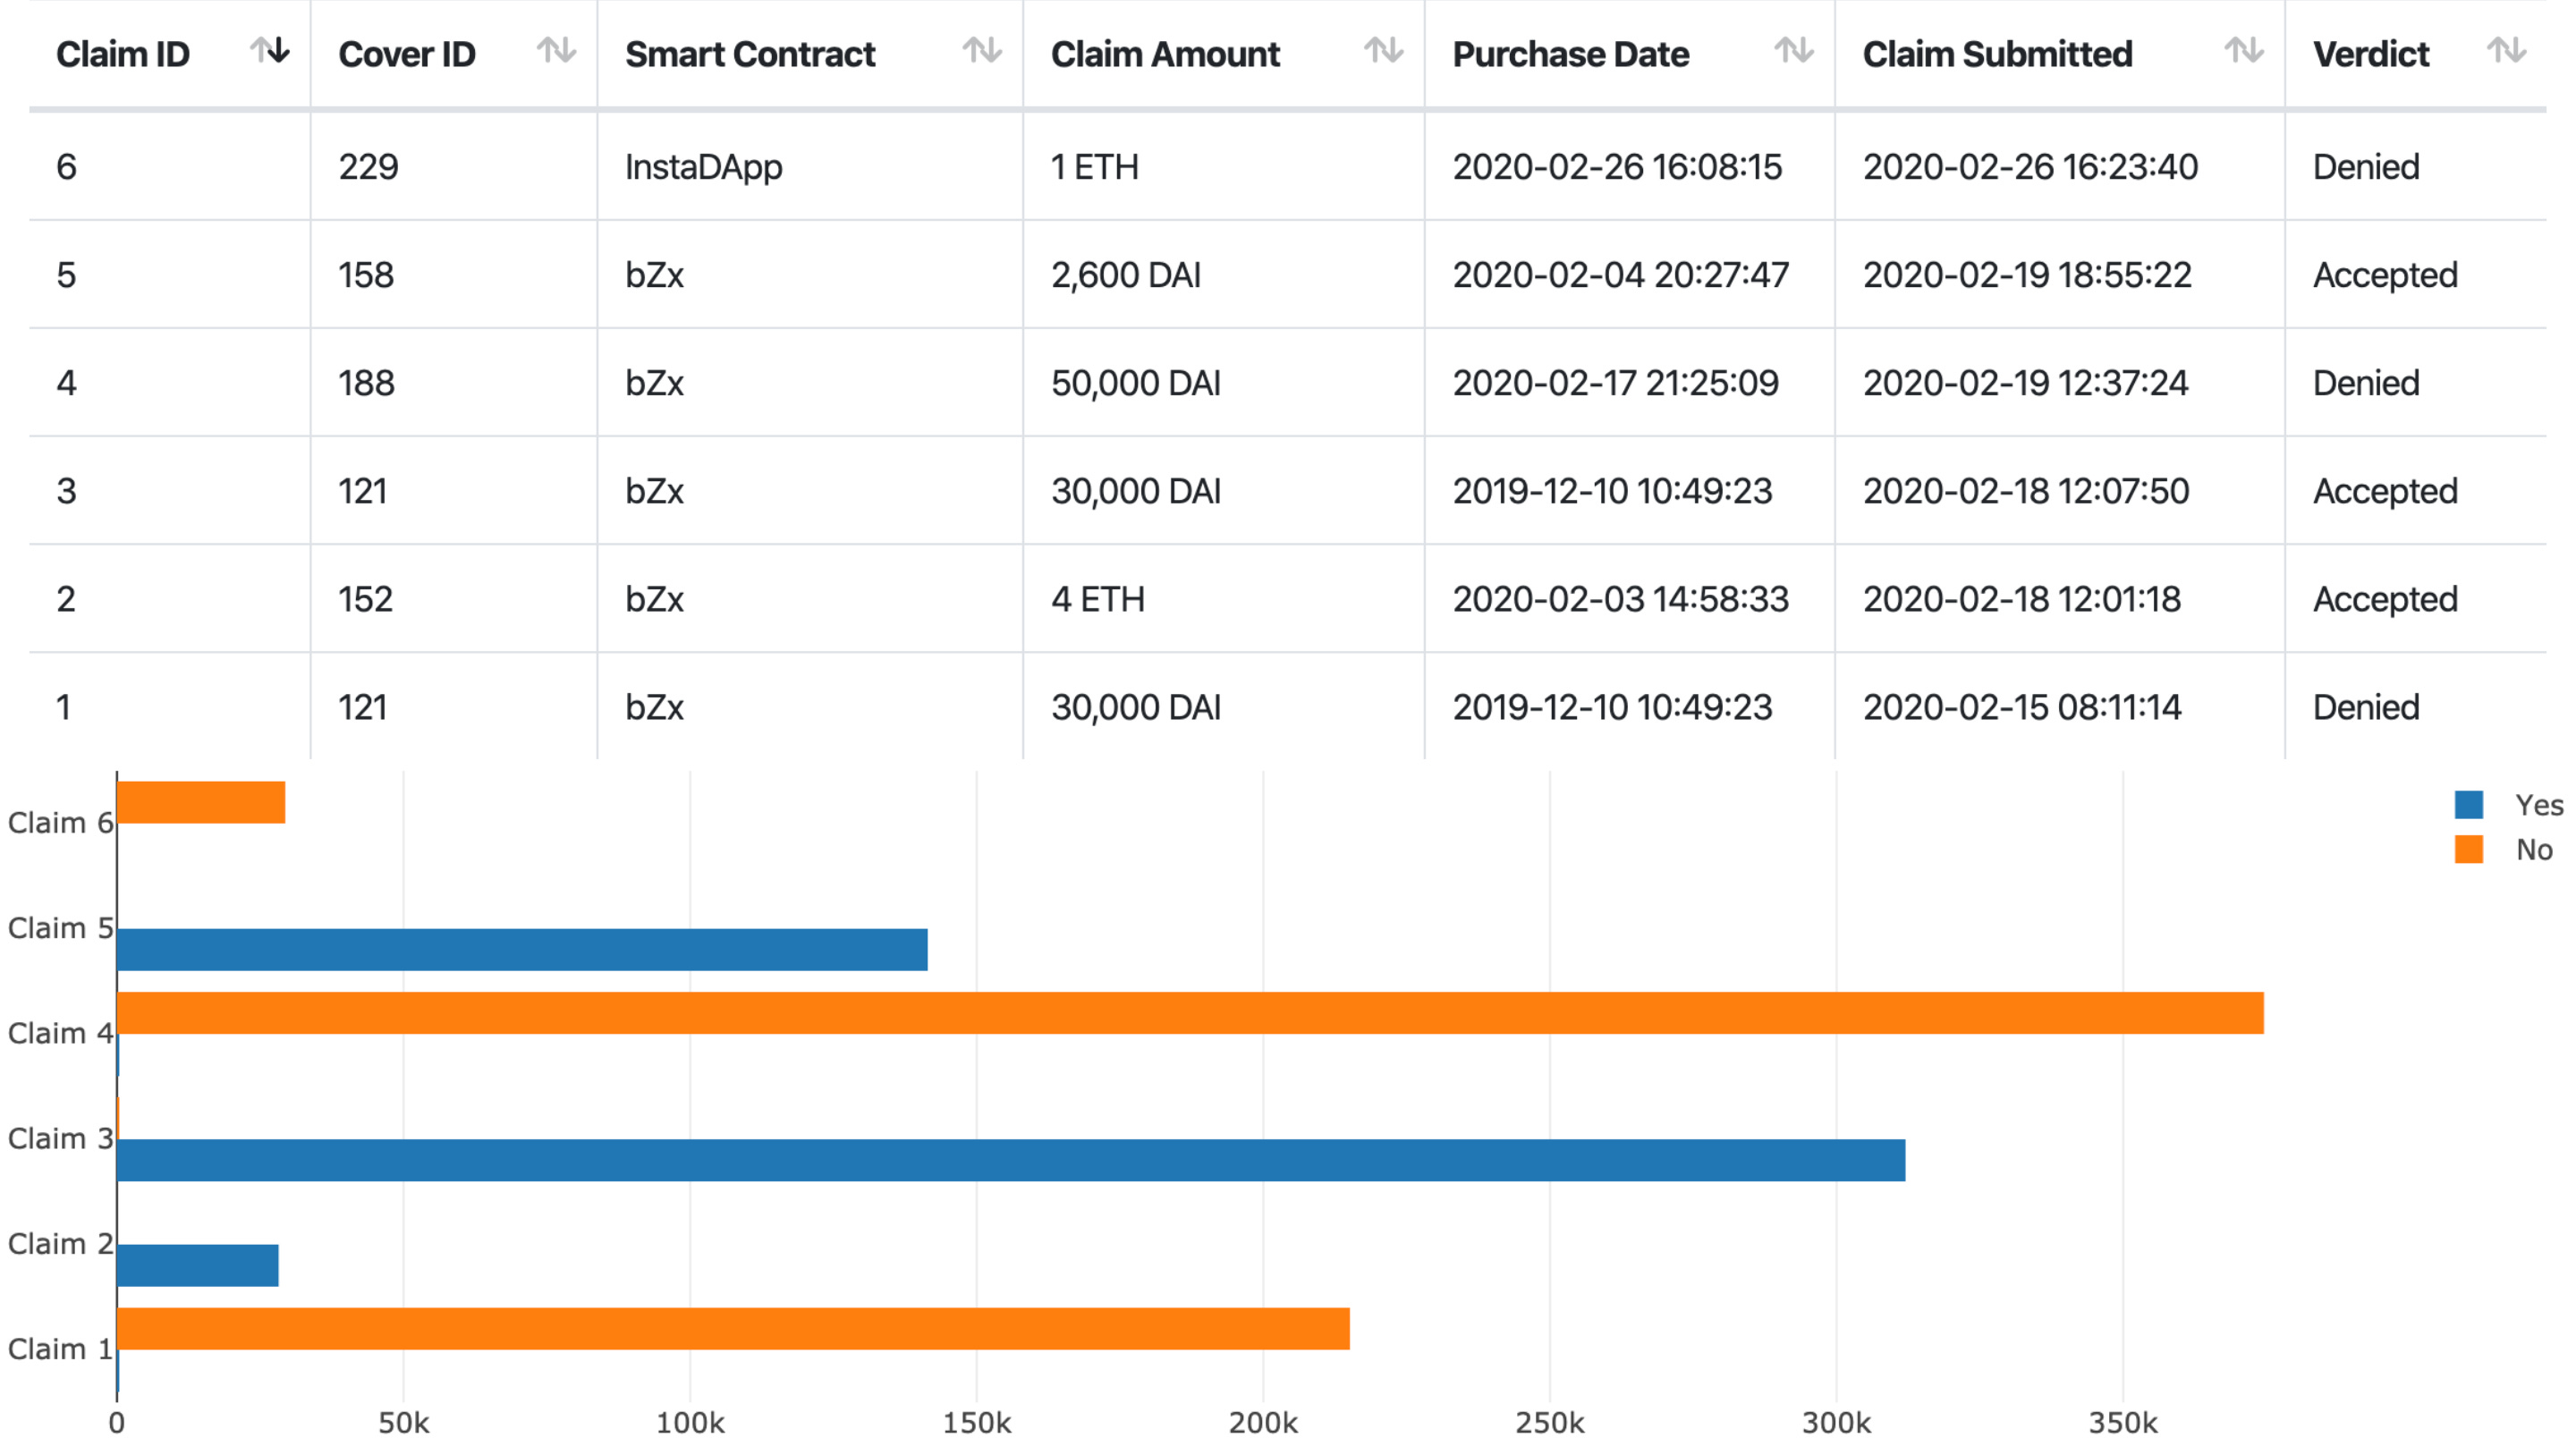
- After the bZx attack, Nexus Mutual paid out its first claims of 4 ETH, 30000 DAI, and 2600 DAI. The claims voting was not contentious (almost unanimous in fact!), showing that the mutual members agreed what was covered by Nexus and what wasn't.
- The bZx attack woke up the DeFi community to the smart contract risk and the need for insurance. If anything, bZx ended up being good marketing for Nexus. After the hack, $1.3M worth of cover was taken out across a variety of smart contracts: 0x, 1inch, Aave, Compound, Curve, DDEX, dYdX, Flexa, Gnosis, HEX, Idle, iearn, InstaDApp, MakerDAO, Nuo Network, Set Protocol, and Uniswap.
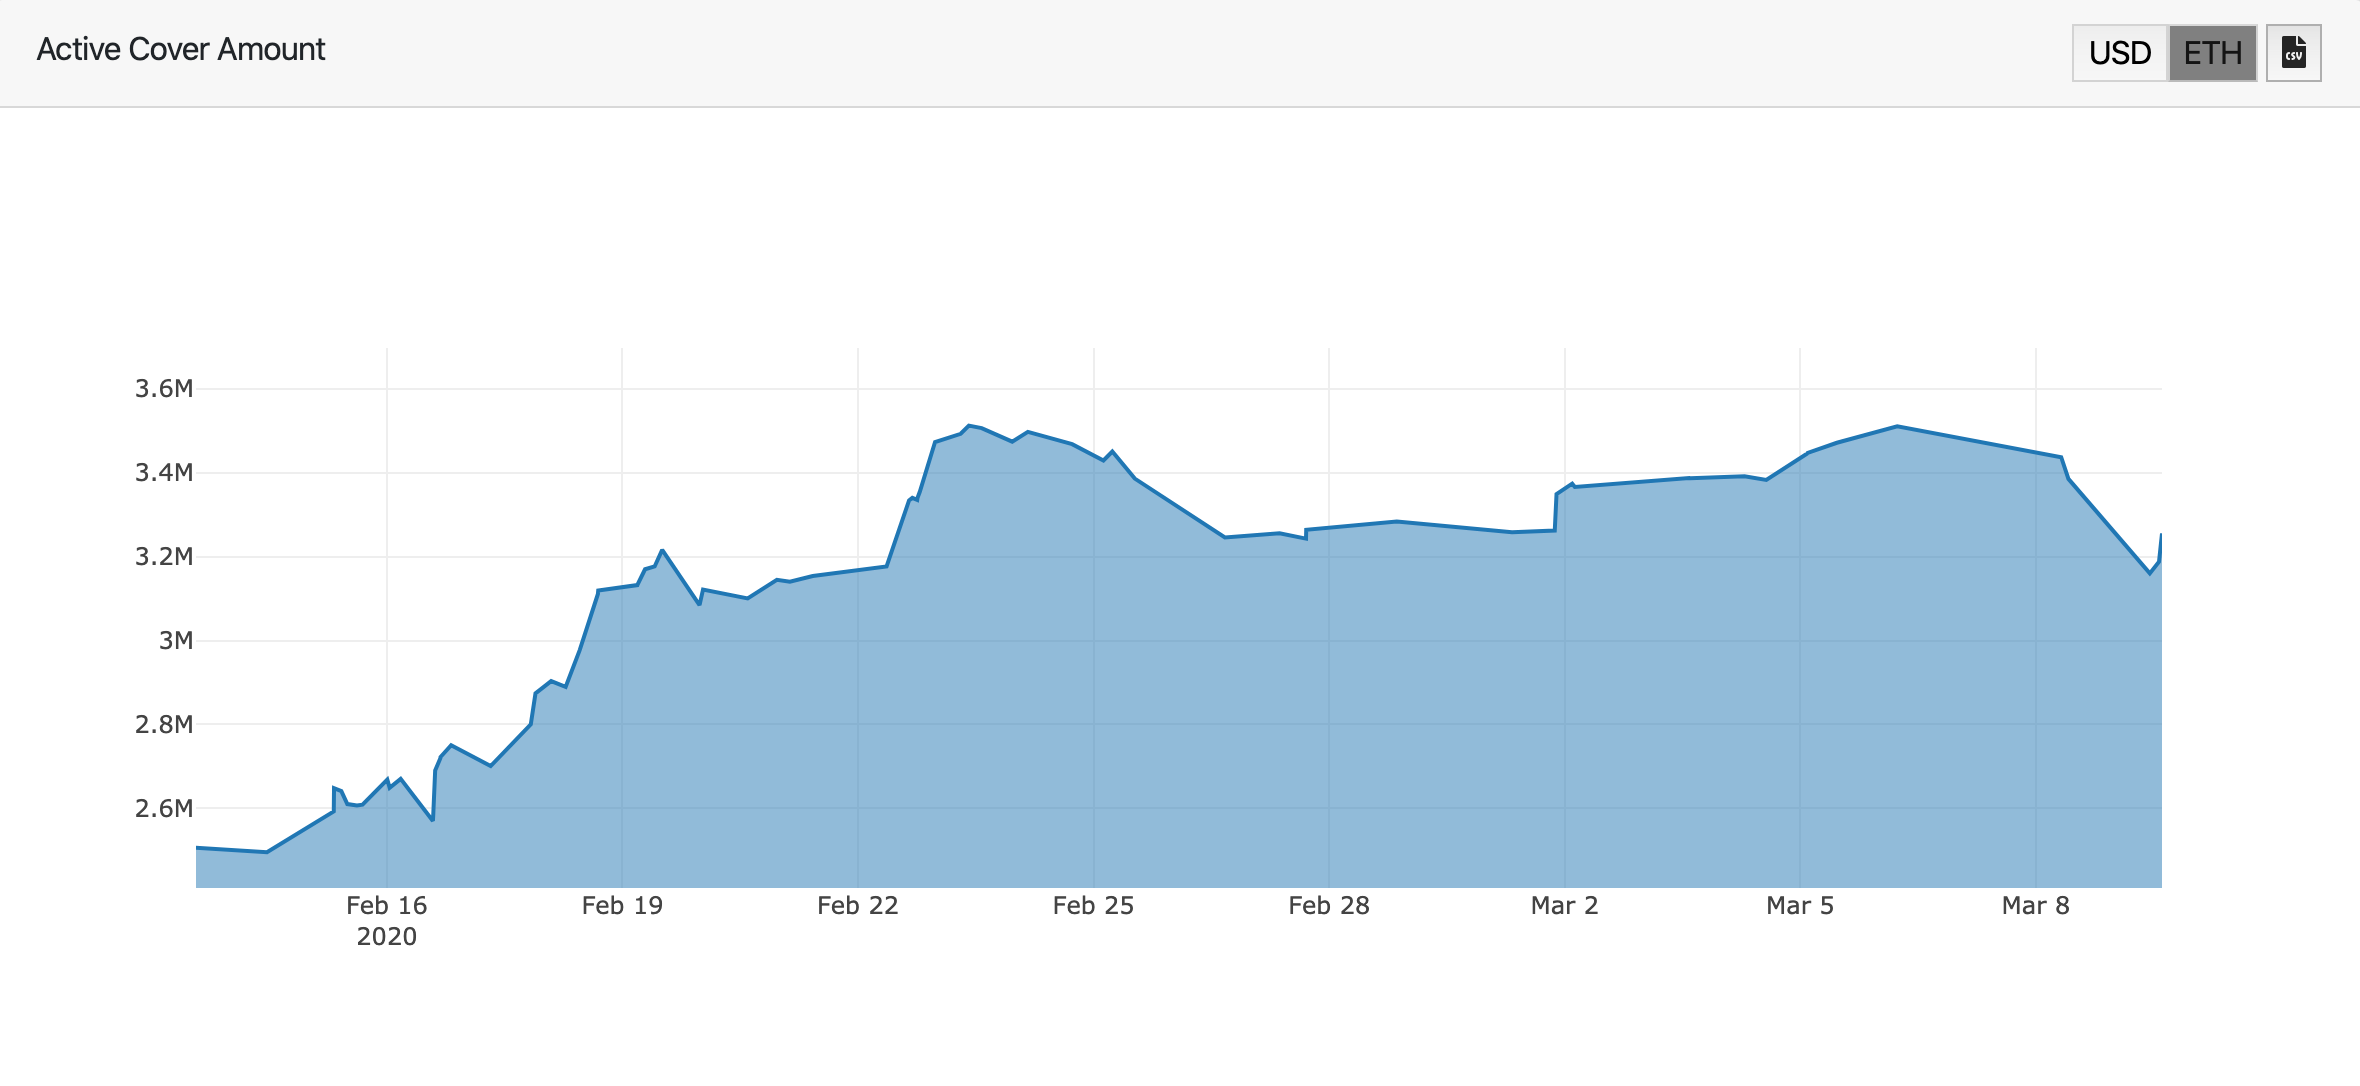
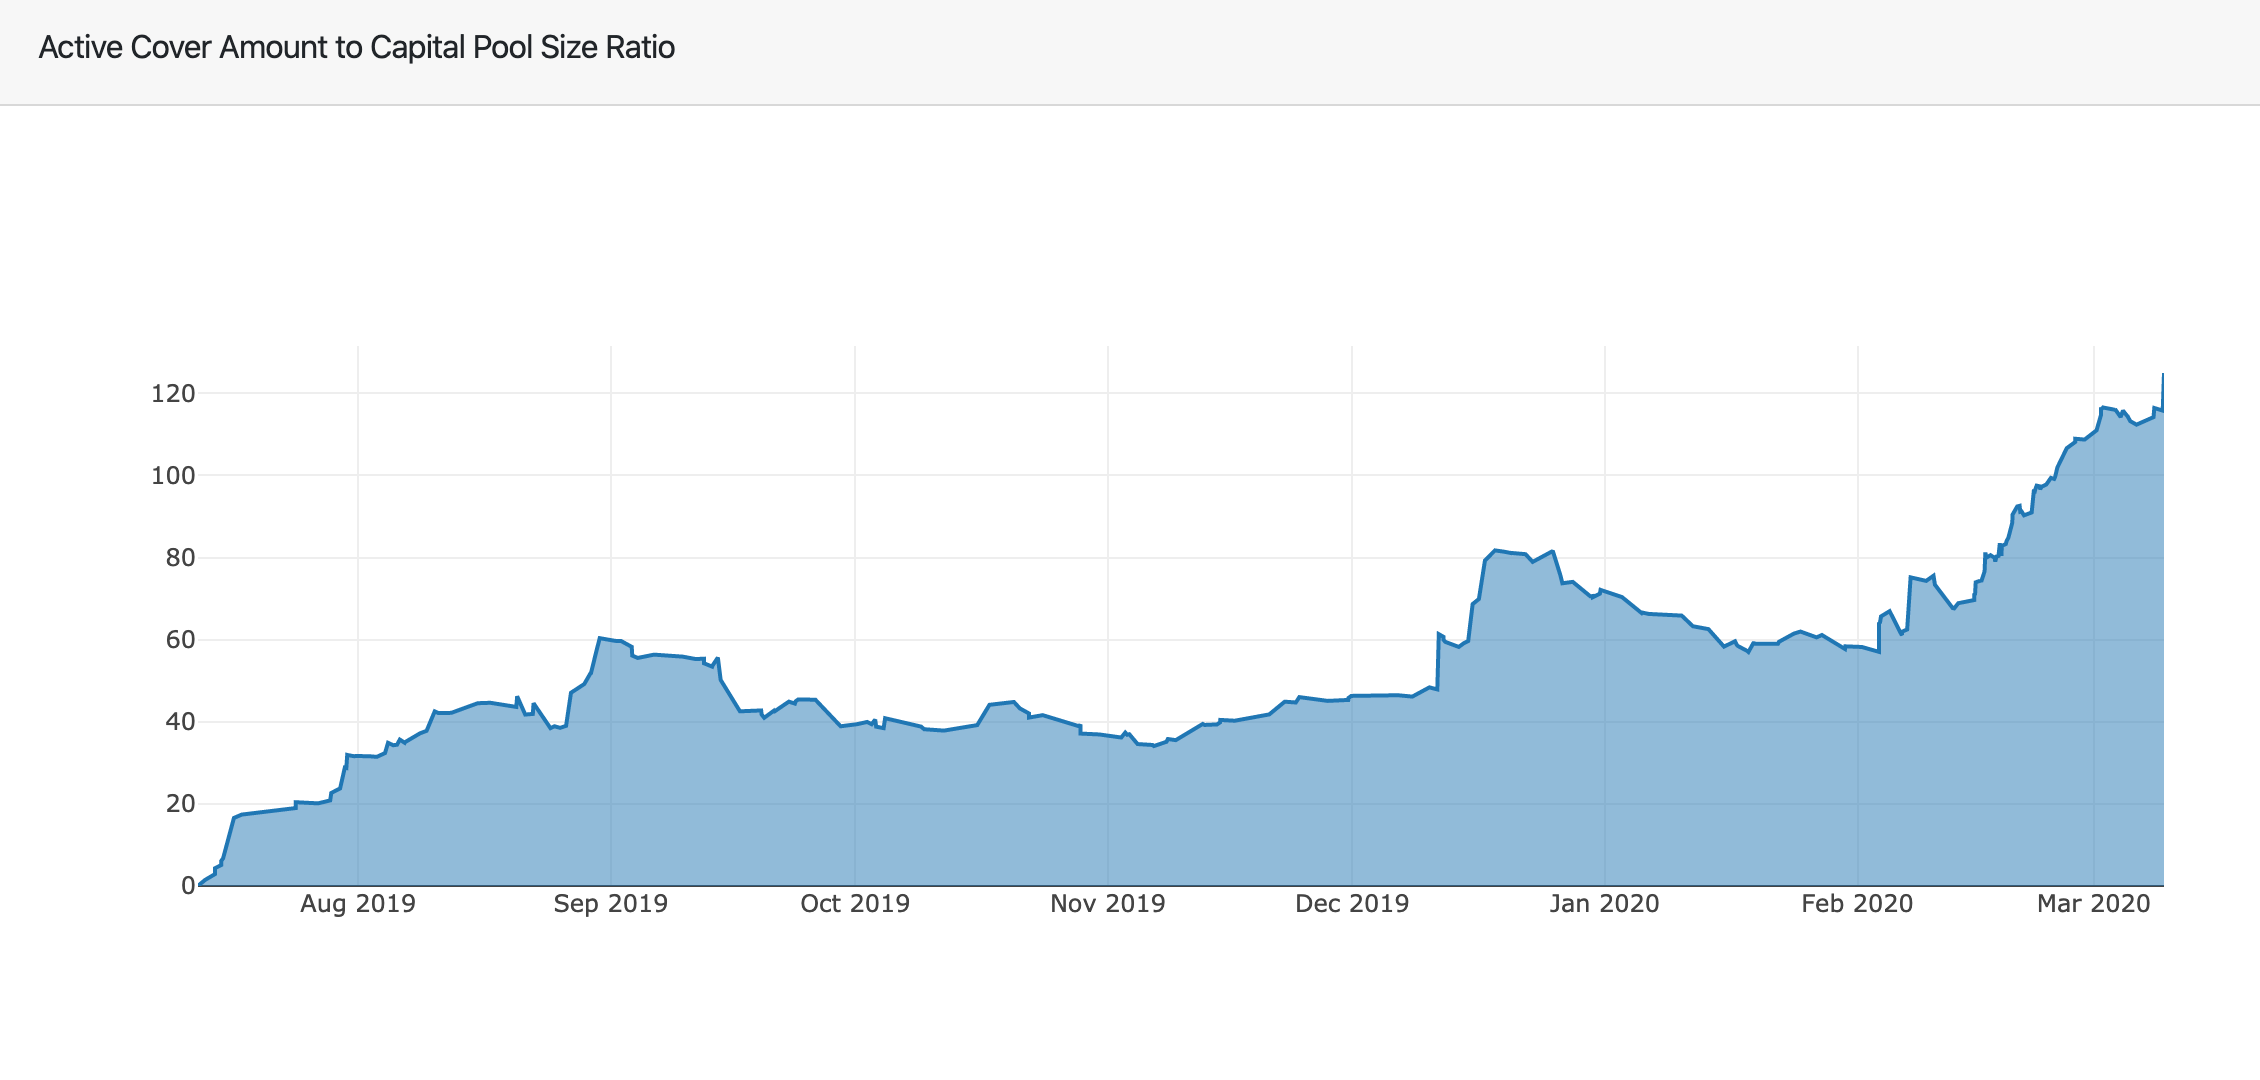
- Nexus Mutual became undercollateralized for the first time. The peer-to-pool (as opposed to peer-to-peer) liquidity model works well for insurance because there can be several times more cover than the capital pool size, so long as claim events aren't correlated. Currently the active cover amount to capital size ratio is 125%. By comparison AIG has a ratio in the order of 6000%.
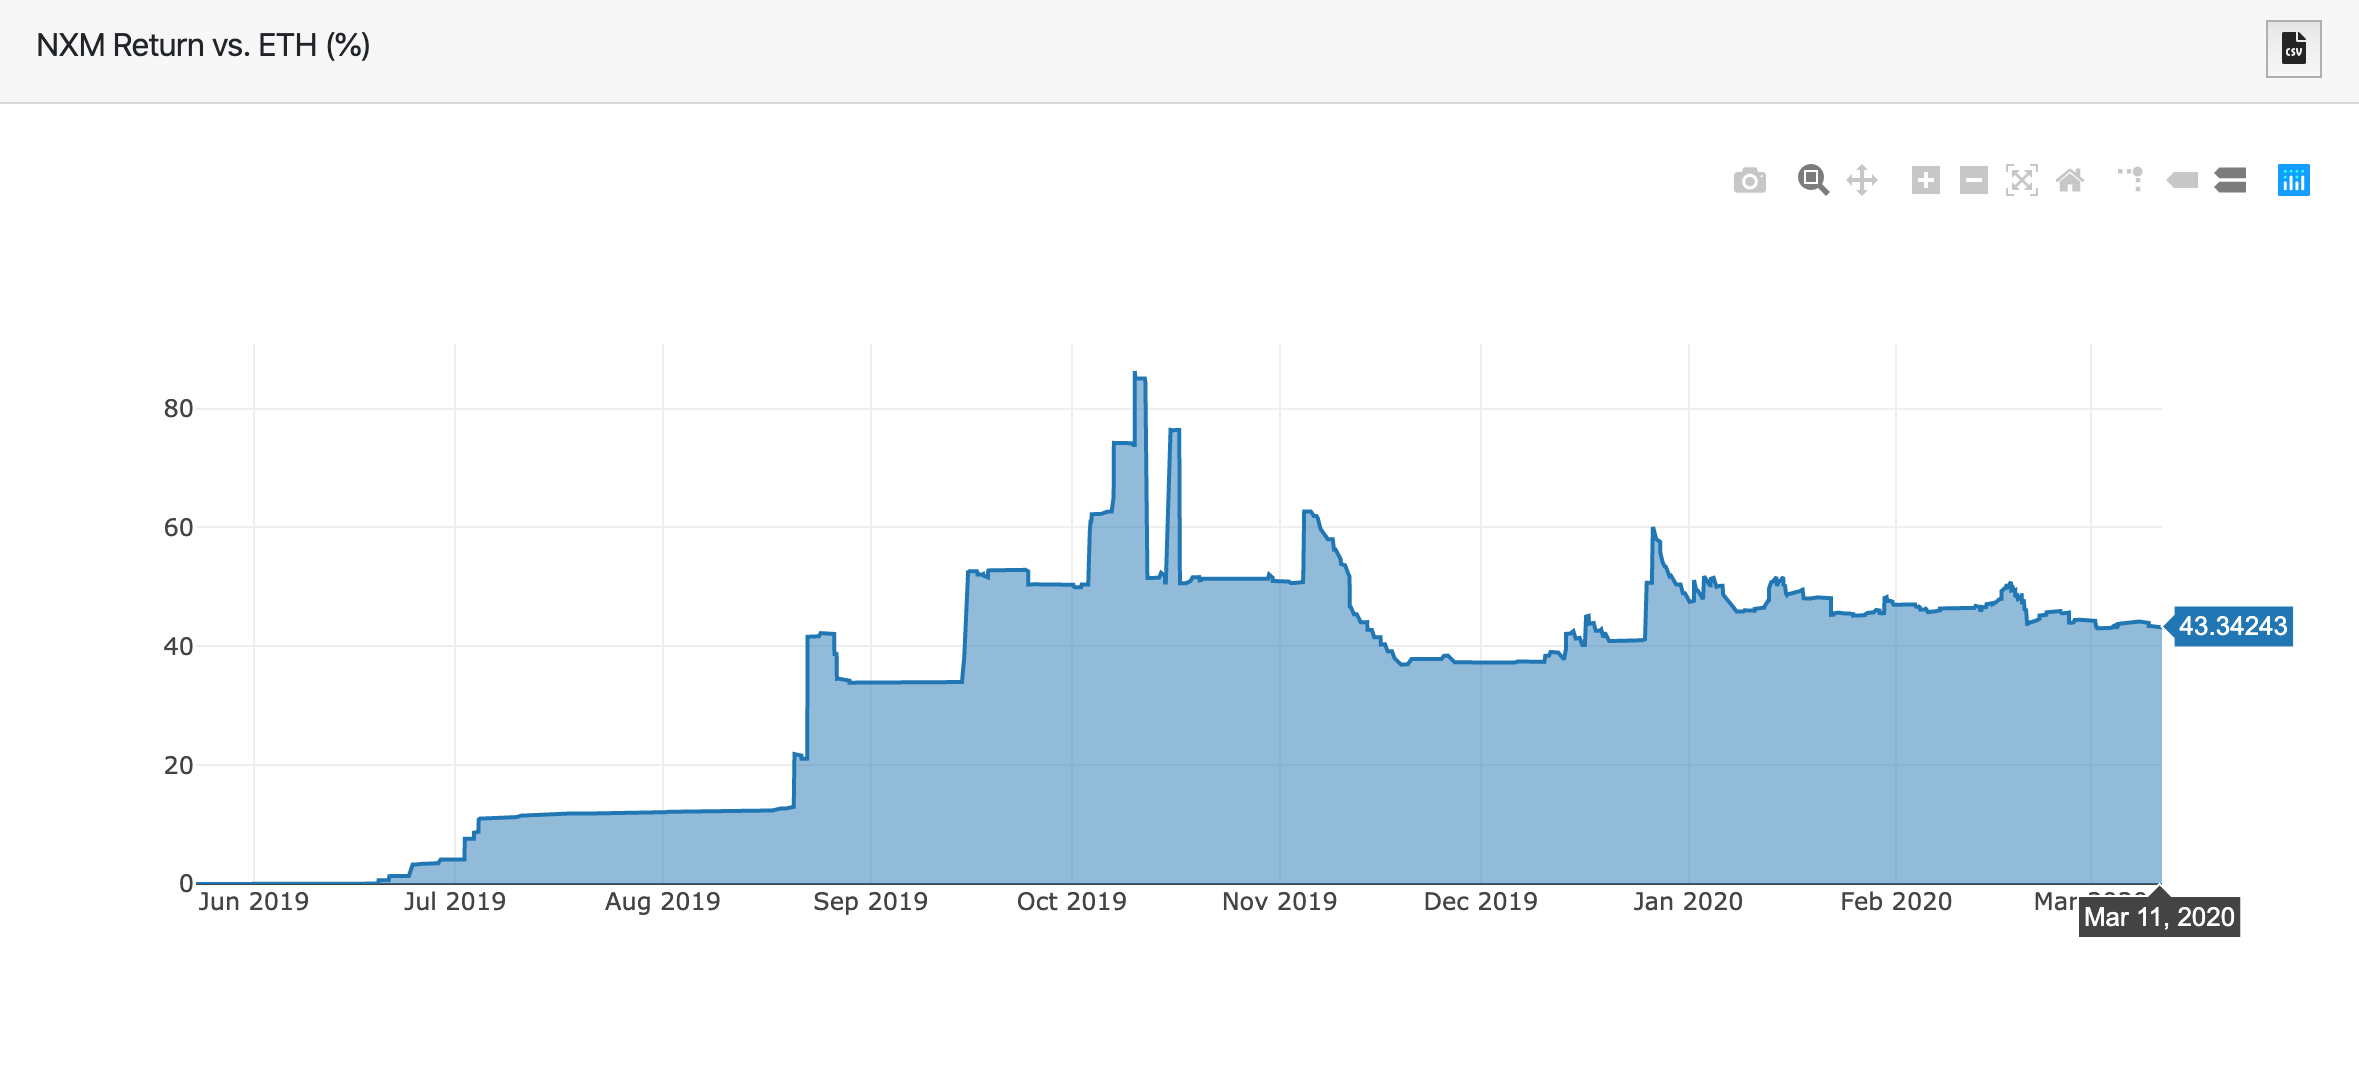
- The NXM token return can be thought of as 1) a leveraged bet on ETH and 2) an index bet on DeFi. Since Nexus Mutual launched last May, NXM has outperformed ETH by 43%.
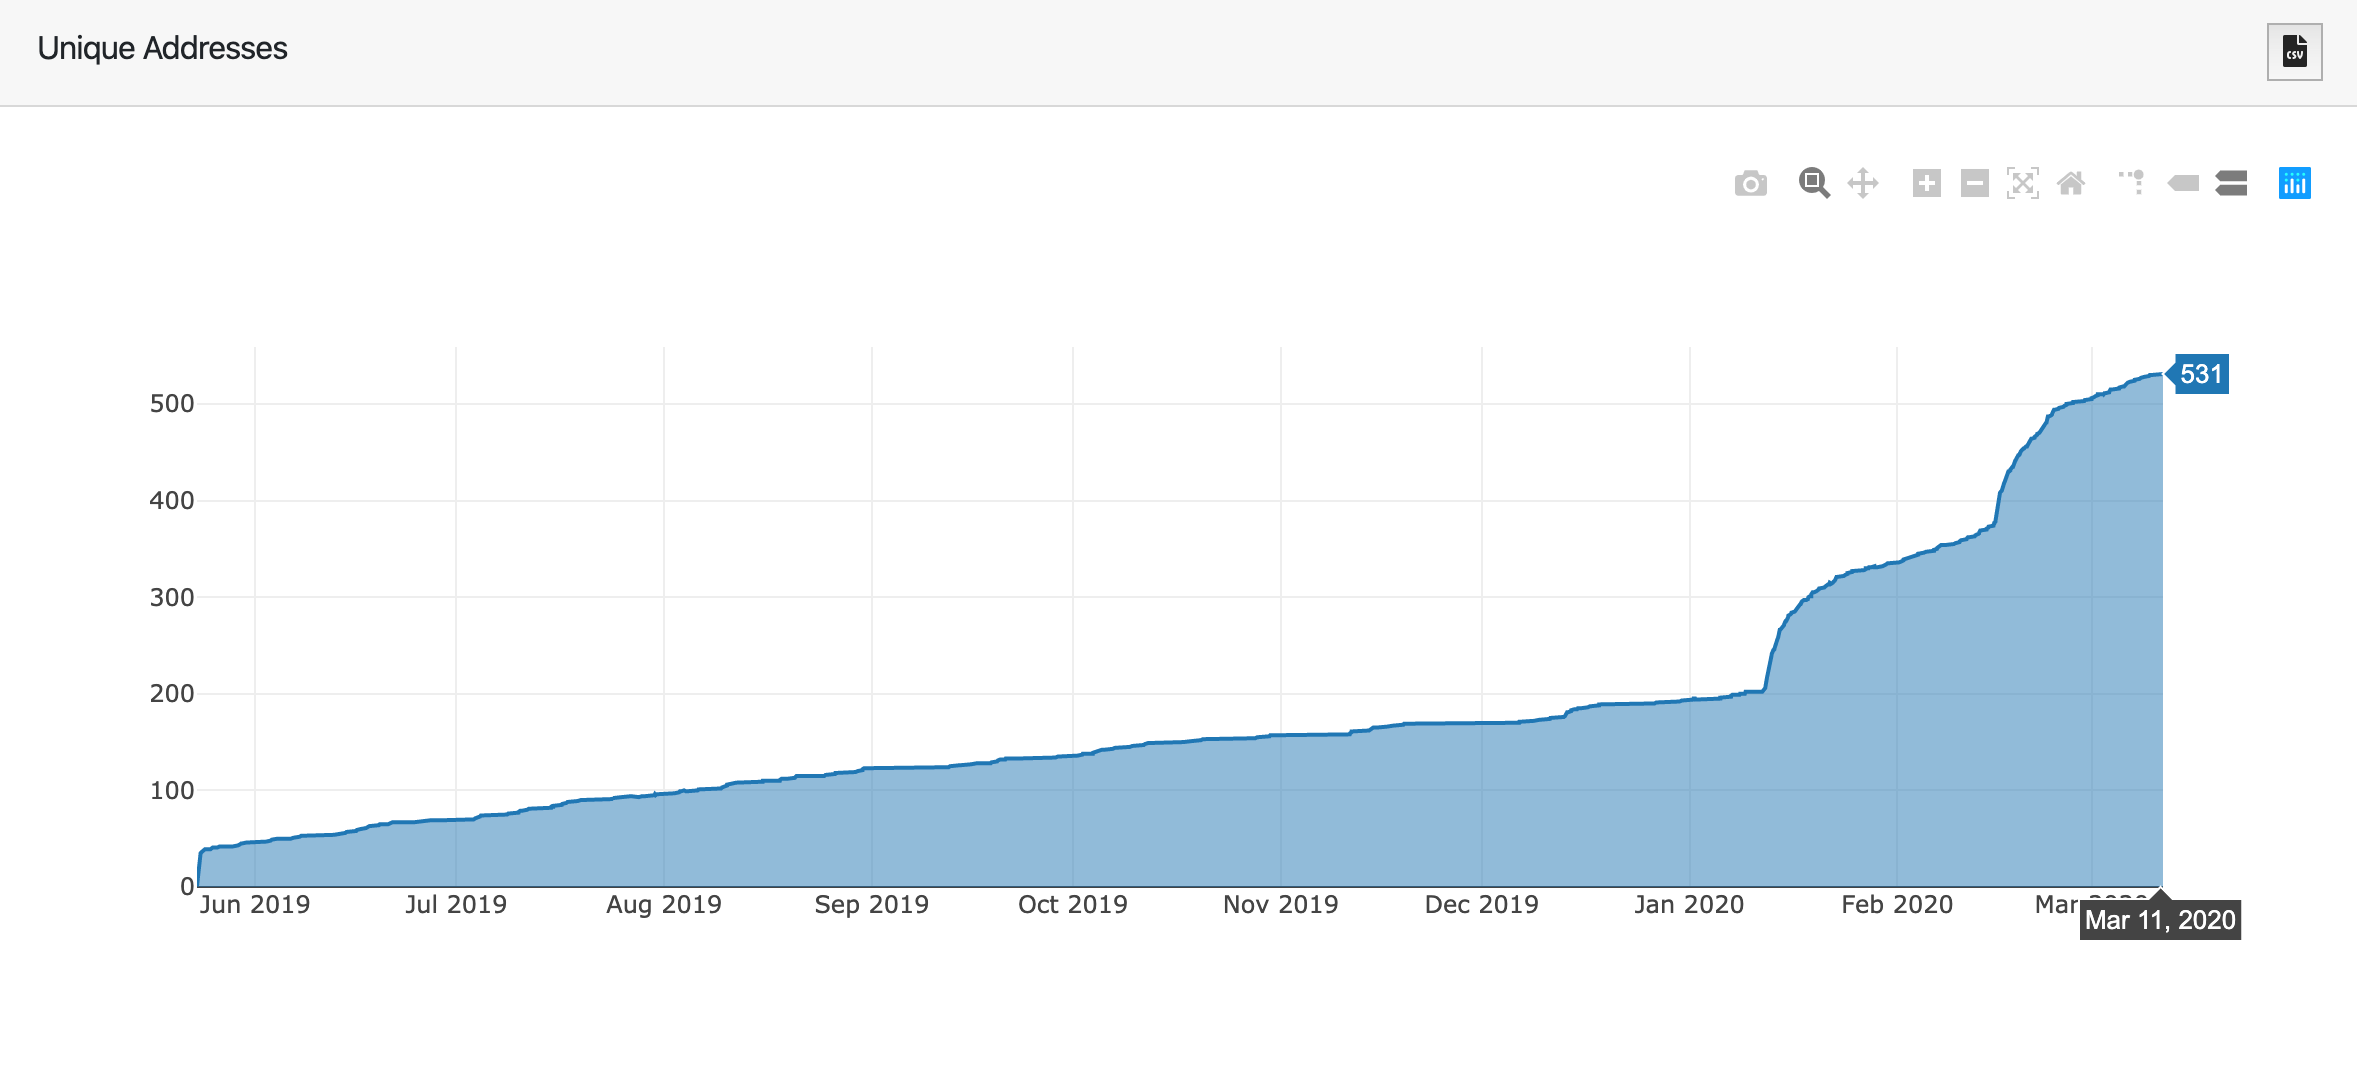
- There are now 531 unique addresses that hold NXM, a large number joining the mutual after the bZx attack.
Contributor: Ankit Chiplunkar, Research Lead at TokenAnalyst
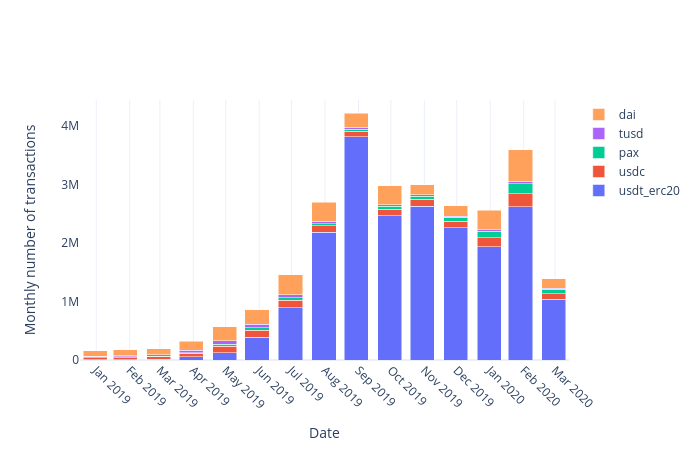
- Monthly Transactions: A total of 26M stablecoin transactions have occurred in the last 15 months. 76% of those transactions are of USDT (ERC20). The stablecoin number of transactions peaked at 4M transactions in Sep 2019.
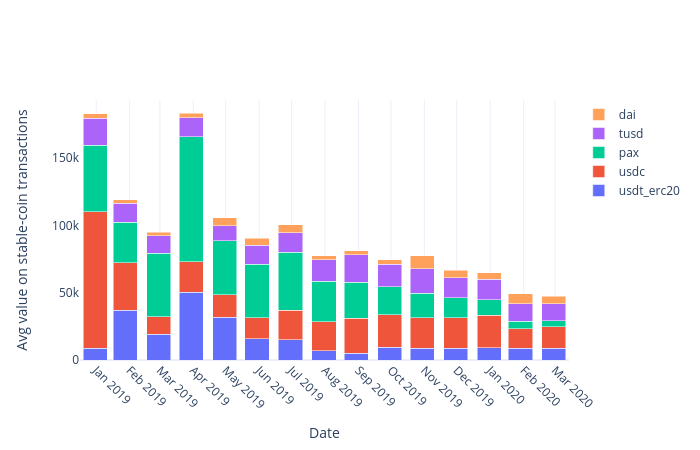
- Average Transaction Value: Over the last 15 months, the average transaction value is highest for USDC ($22k) and lowest for DAI ($5k). As you can see, the average value of transactions has been decreasing over time. Notably, in Jan 2019 the average transaction value of USDC was $100k, which has dropped to $16k in Mar 2020.
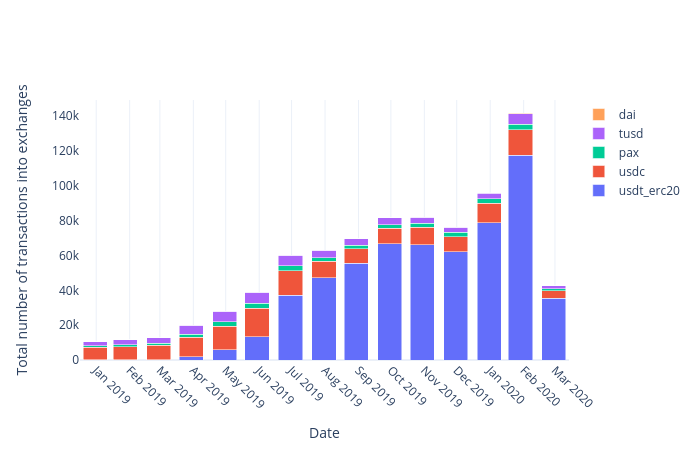
- Exchange Inbound Transactions: A total of 835k transactions were the result of stablecoins being sent into exchanges over the last 15 months. Of those transactions, 70% were USDT (ERC20) while 18% were USDC. This figure peaked at 140M transactions in Feb 2020, and the numbers continue to climb.
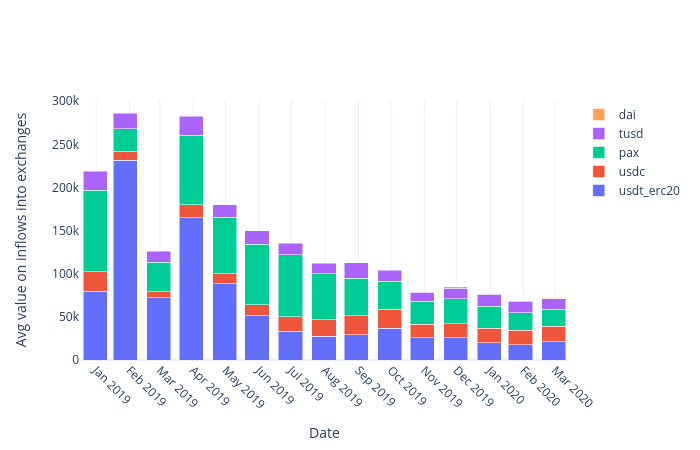
- Exchange Monthly Inflows: Since Jan 2019, USDT has posted the highest average monthly inflows among stablecoins at $27k/month while DAI has posted the lowest at just $1k/month. The total monthly inflow value of stablecoins has been trending downward over time, likely because there was a mass onboarding of ERC20 stablecoin liquidity to exchanges in Jan 2019.
Contributor: Leighton Cusack, CEO of PoolTogether
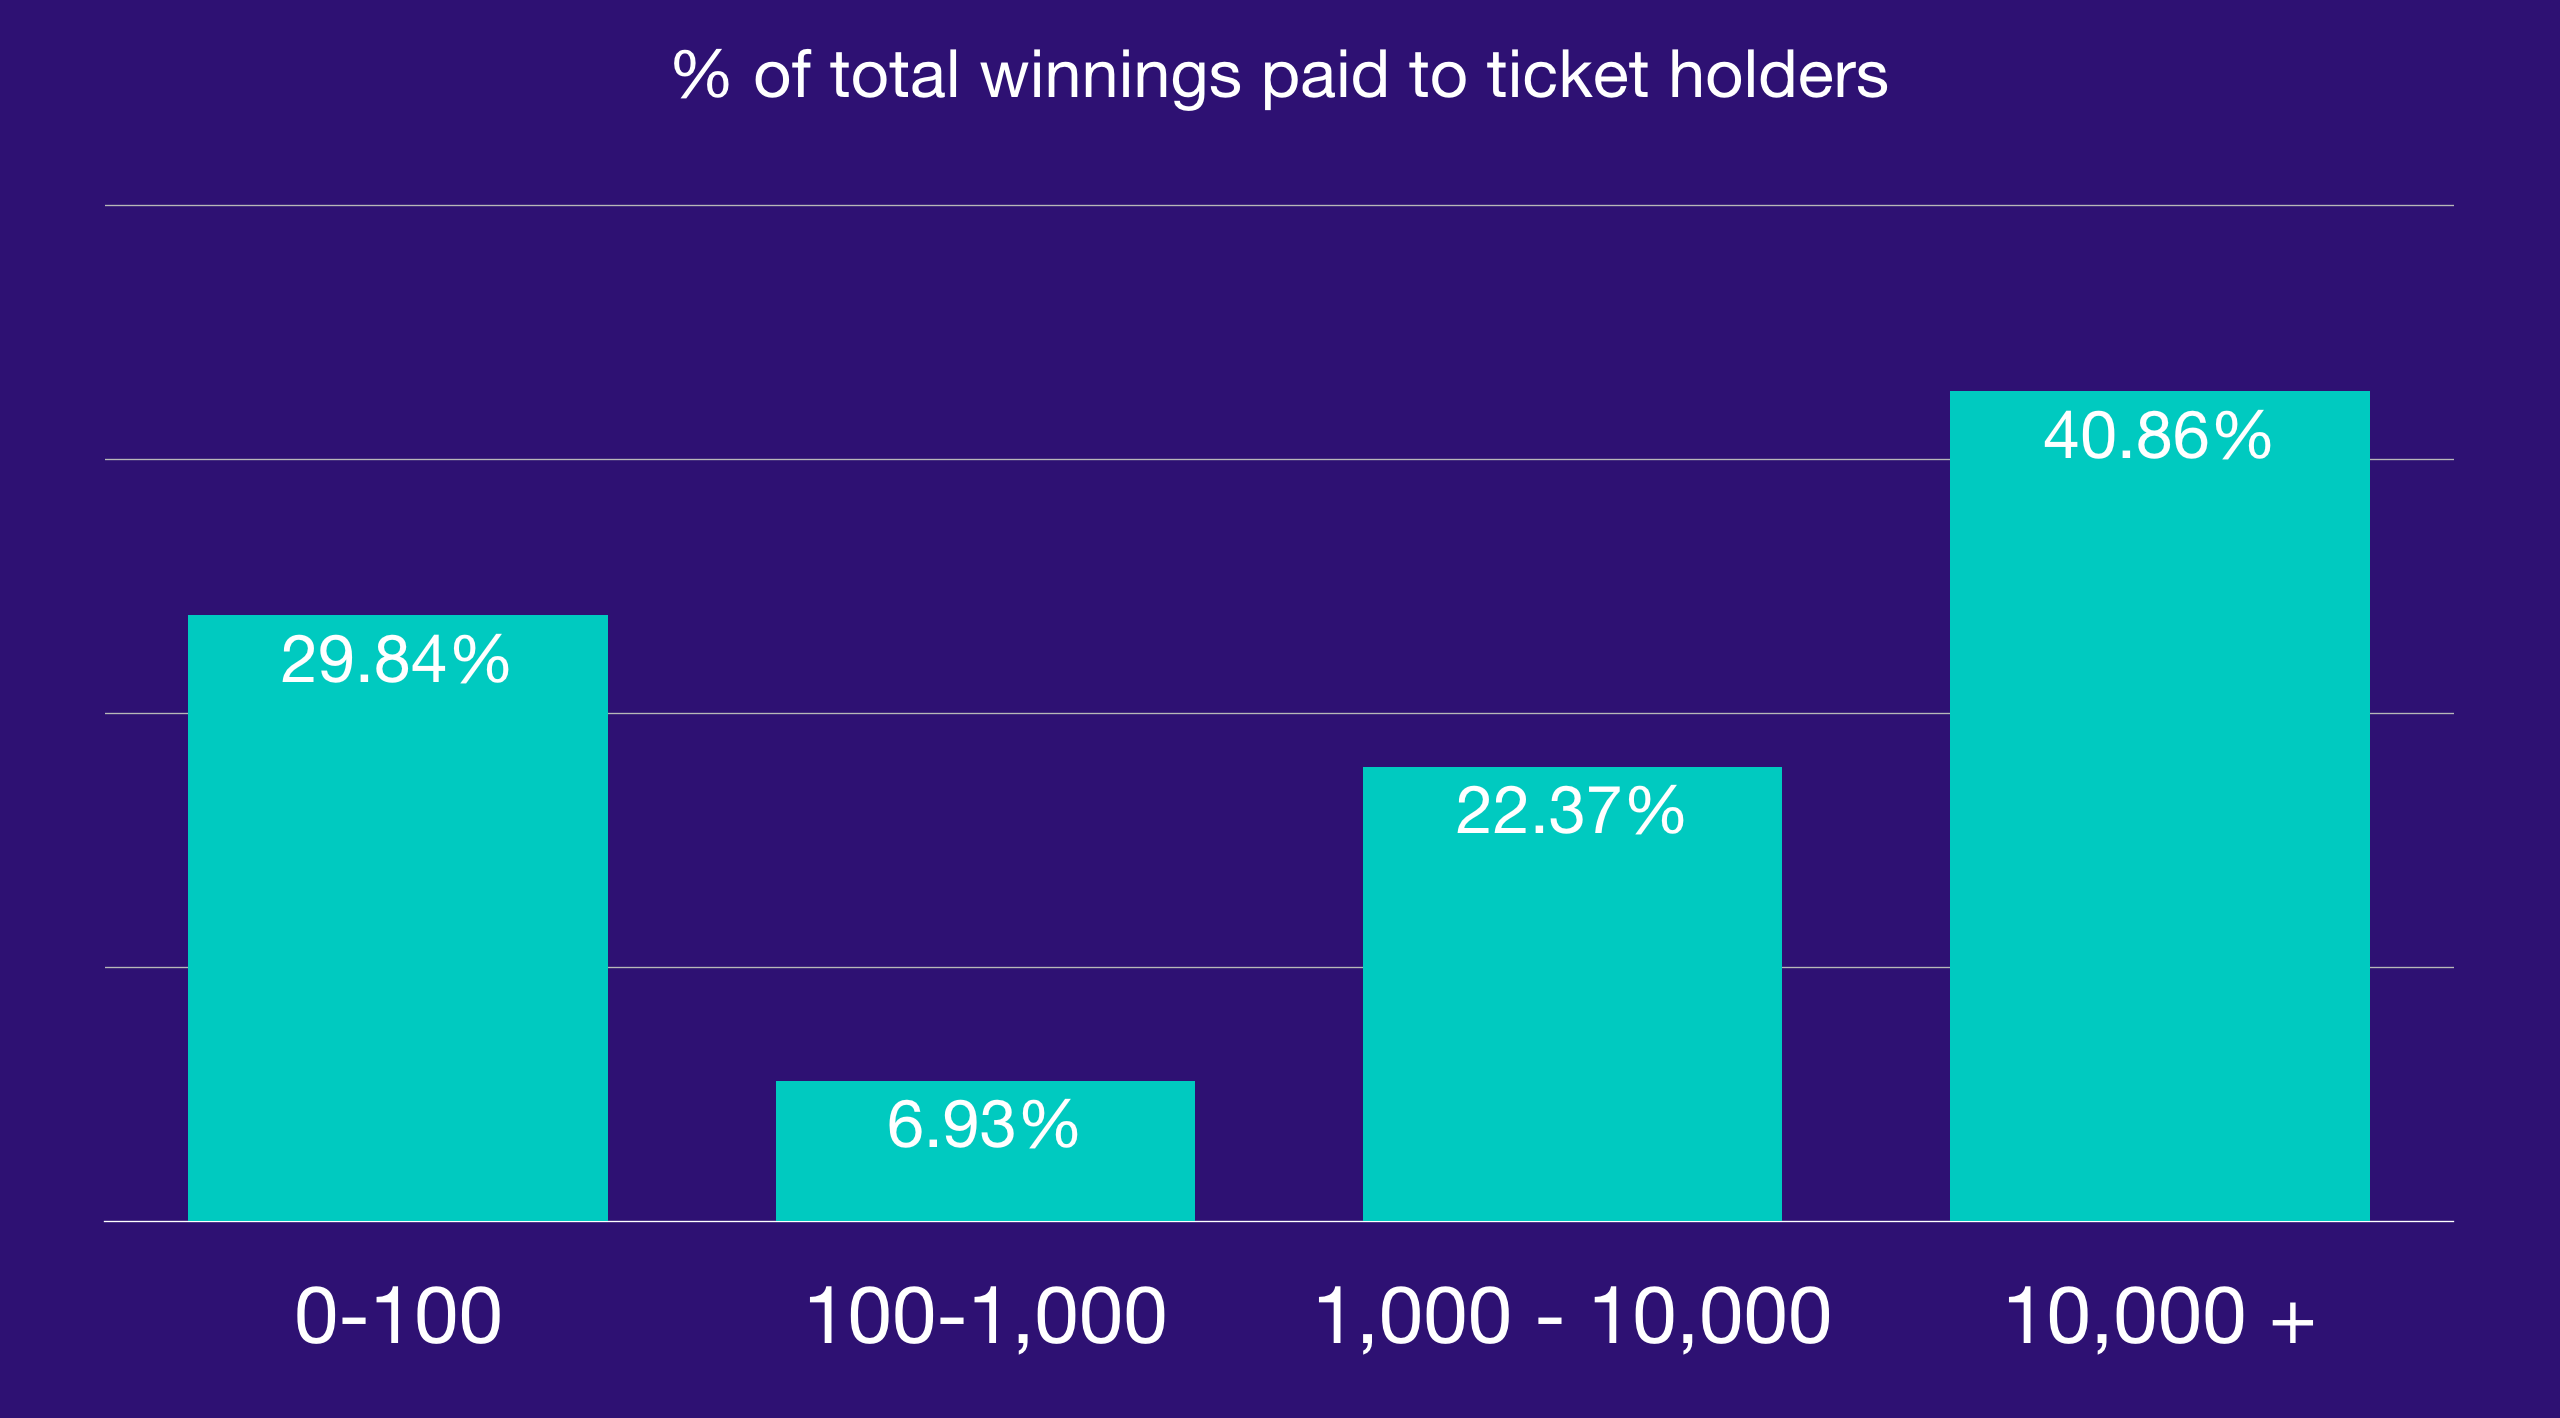
- PoolTogether is a prize savings protocol. The Dai pool launched 11 weeks ago has now distributed over $10,000 Dai in prizes. The following chart shows what percent of total winnings have been paid out to ticket holders in each category. 30% of all prizes have been paid out to addresses holding less than 100 Dai (1 Dai = 1 ticket). The luckiest winner had deposited 5 Dai and won 1,448.
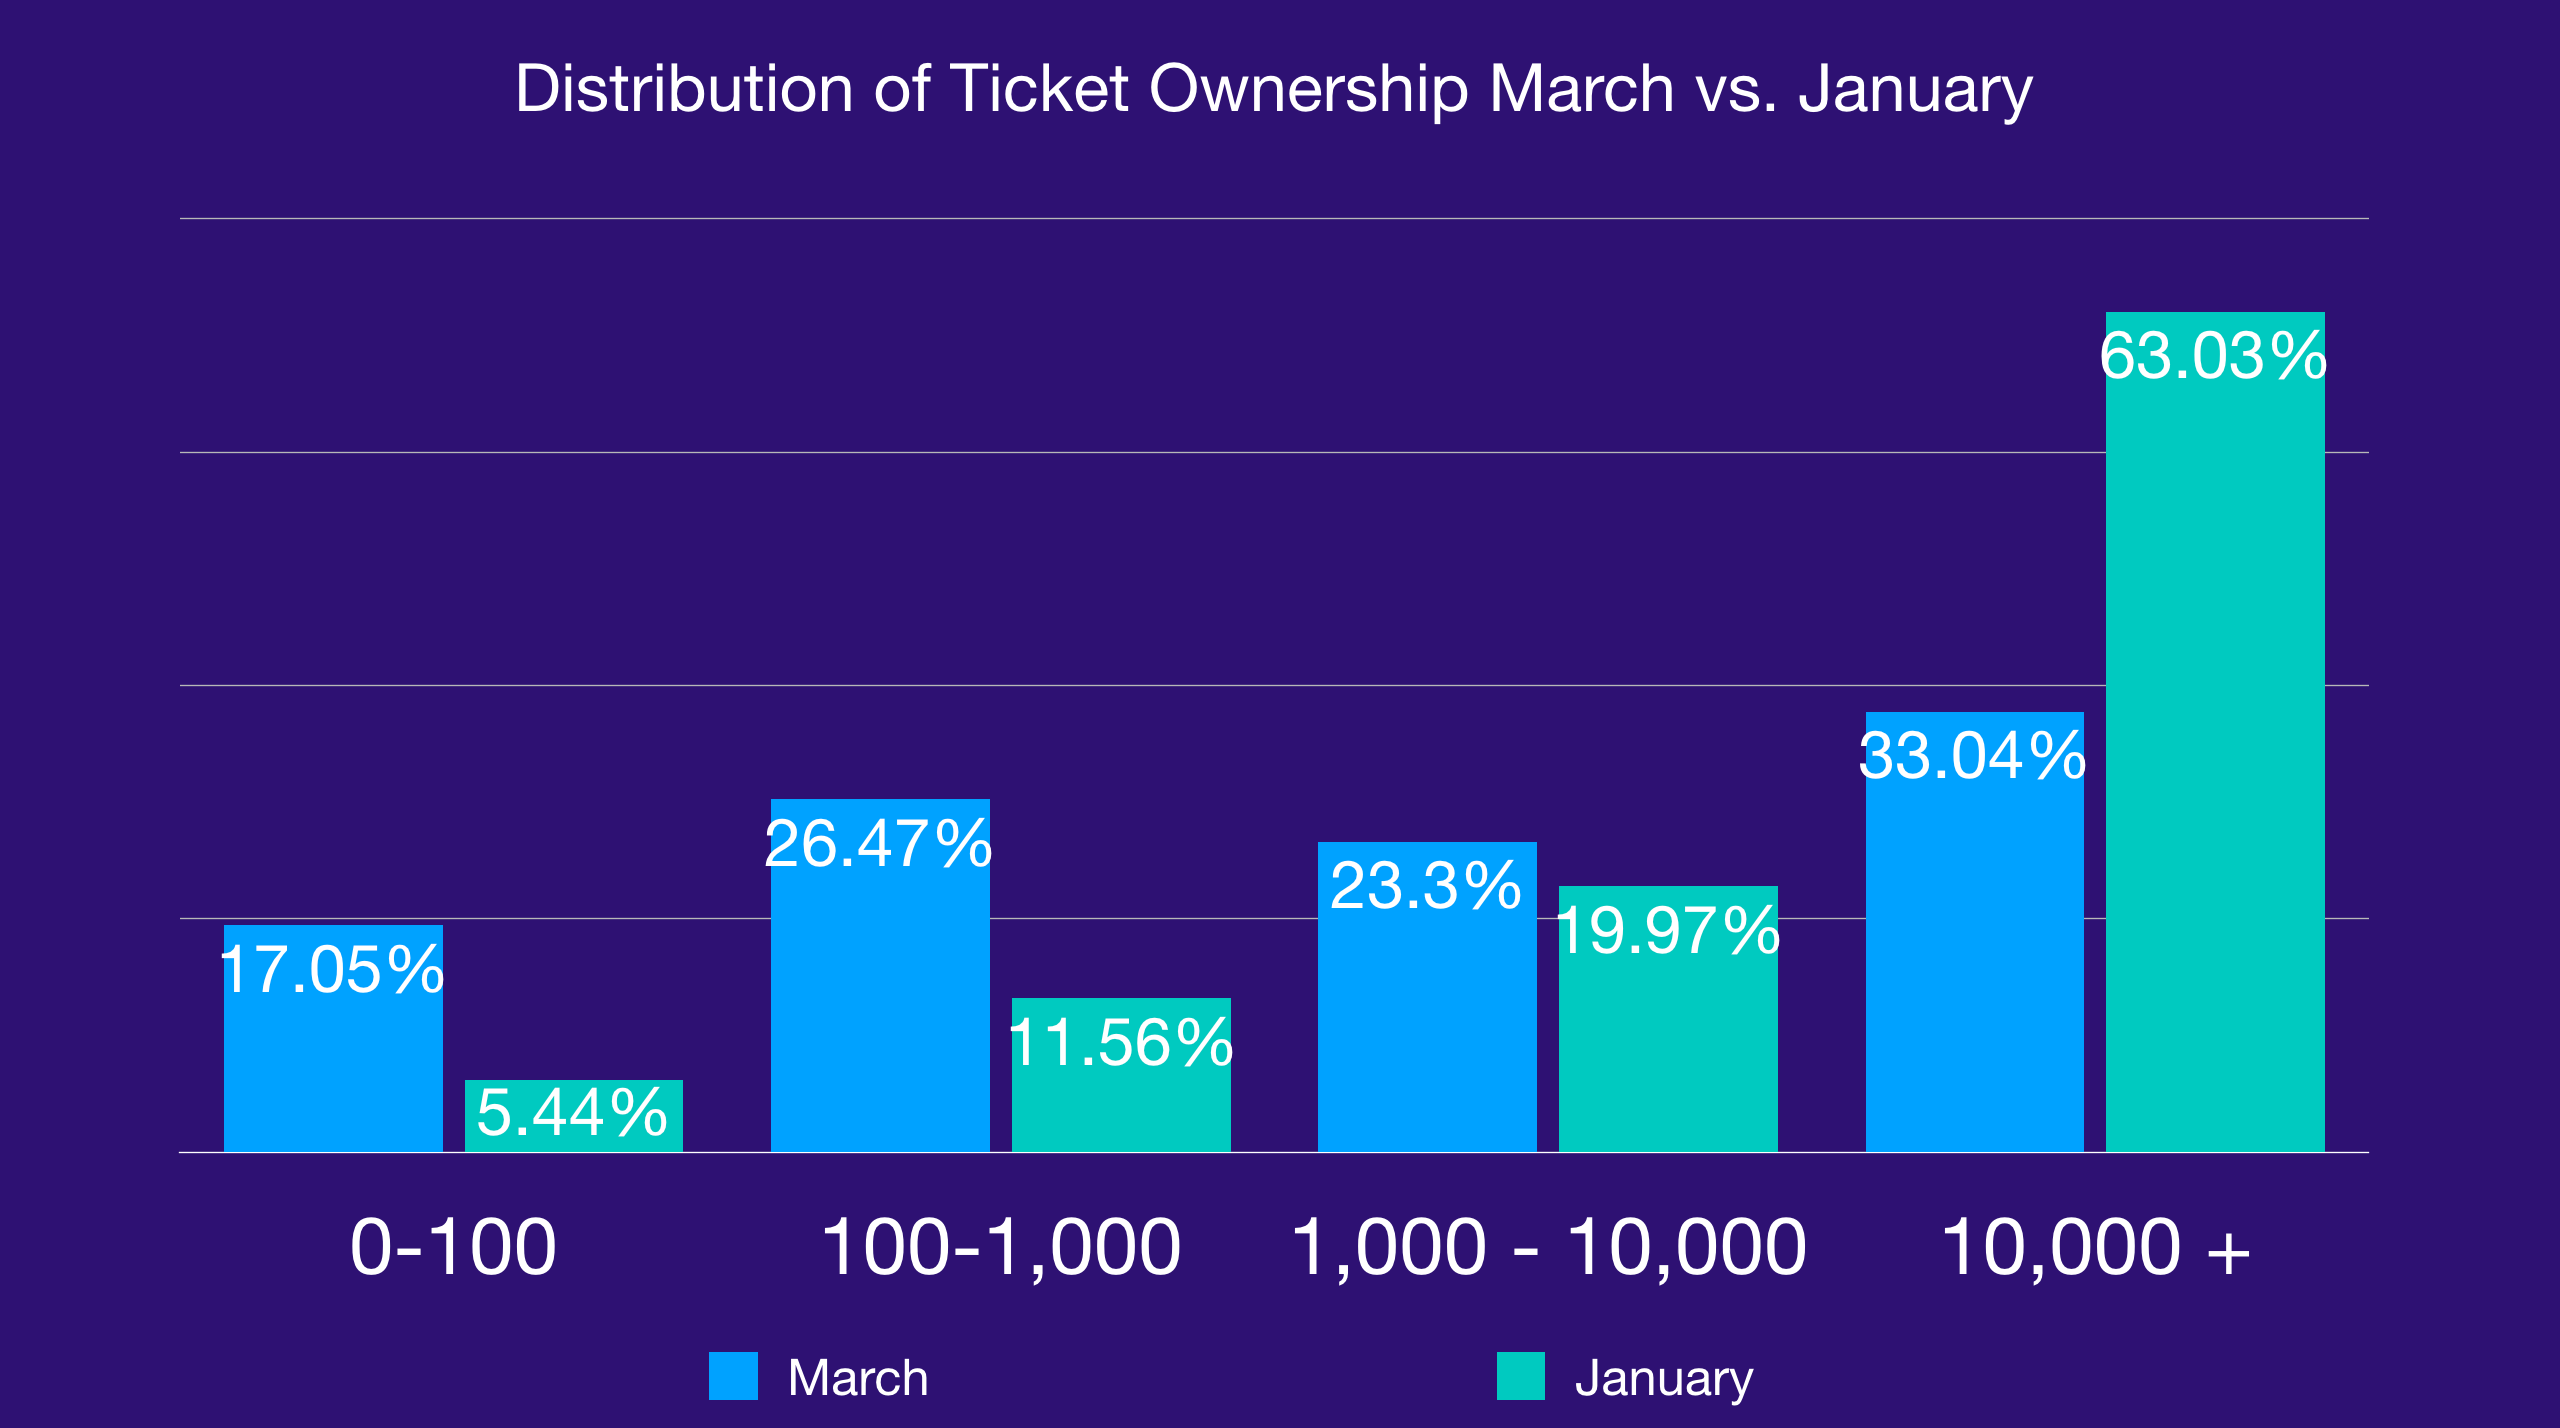
- A major trend of 2020 is less tickets owned by whales and more tickets owned by smaller addresses. As of March 10th, 17% of all tickets are owned by accounts with less than 100 tickets. In contrast on January 31st only 5.44% of total tickets were owned by accounts with less than 100. During this period, the total pool size continued to increase.
- Unique Ethereum addresses in the pool has continued to grow currently averaging 30.42% week over week for the last 11 weeks.
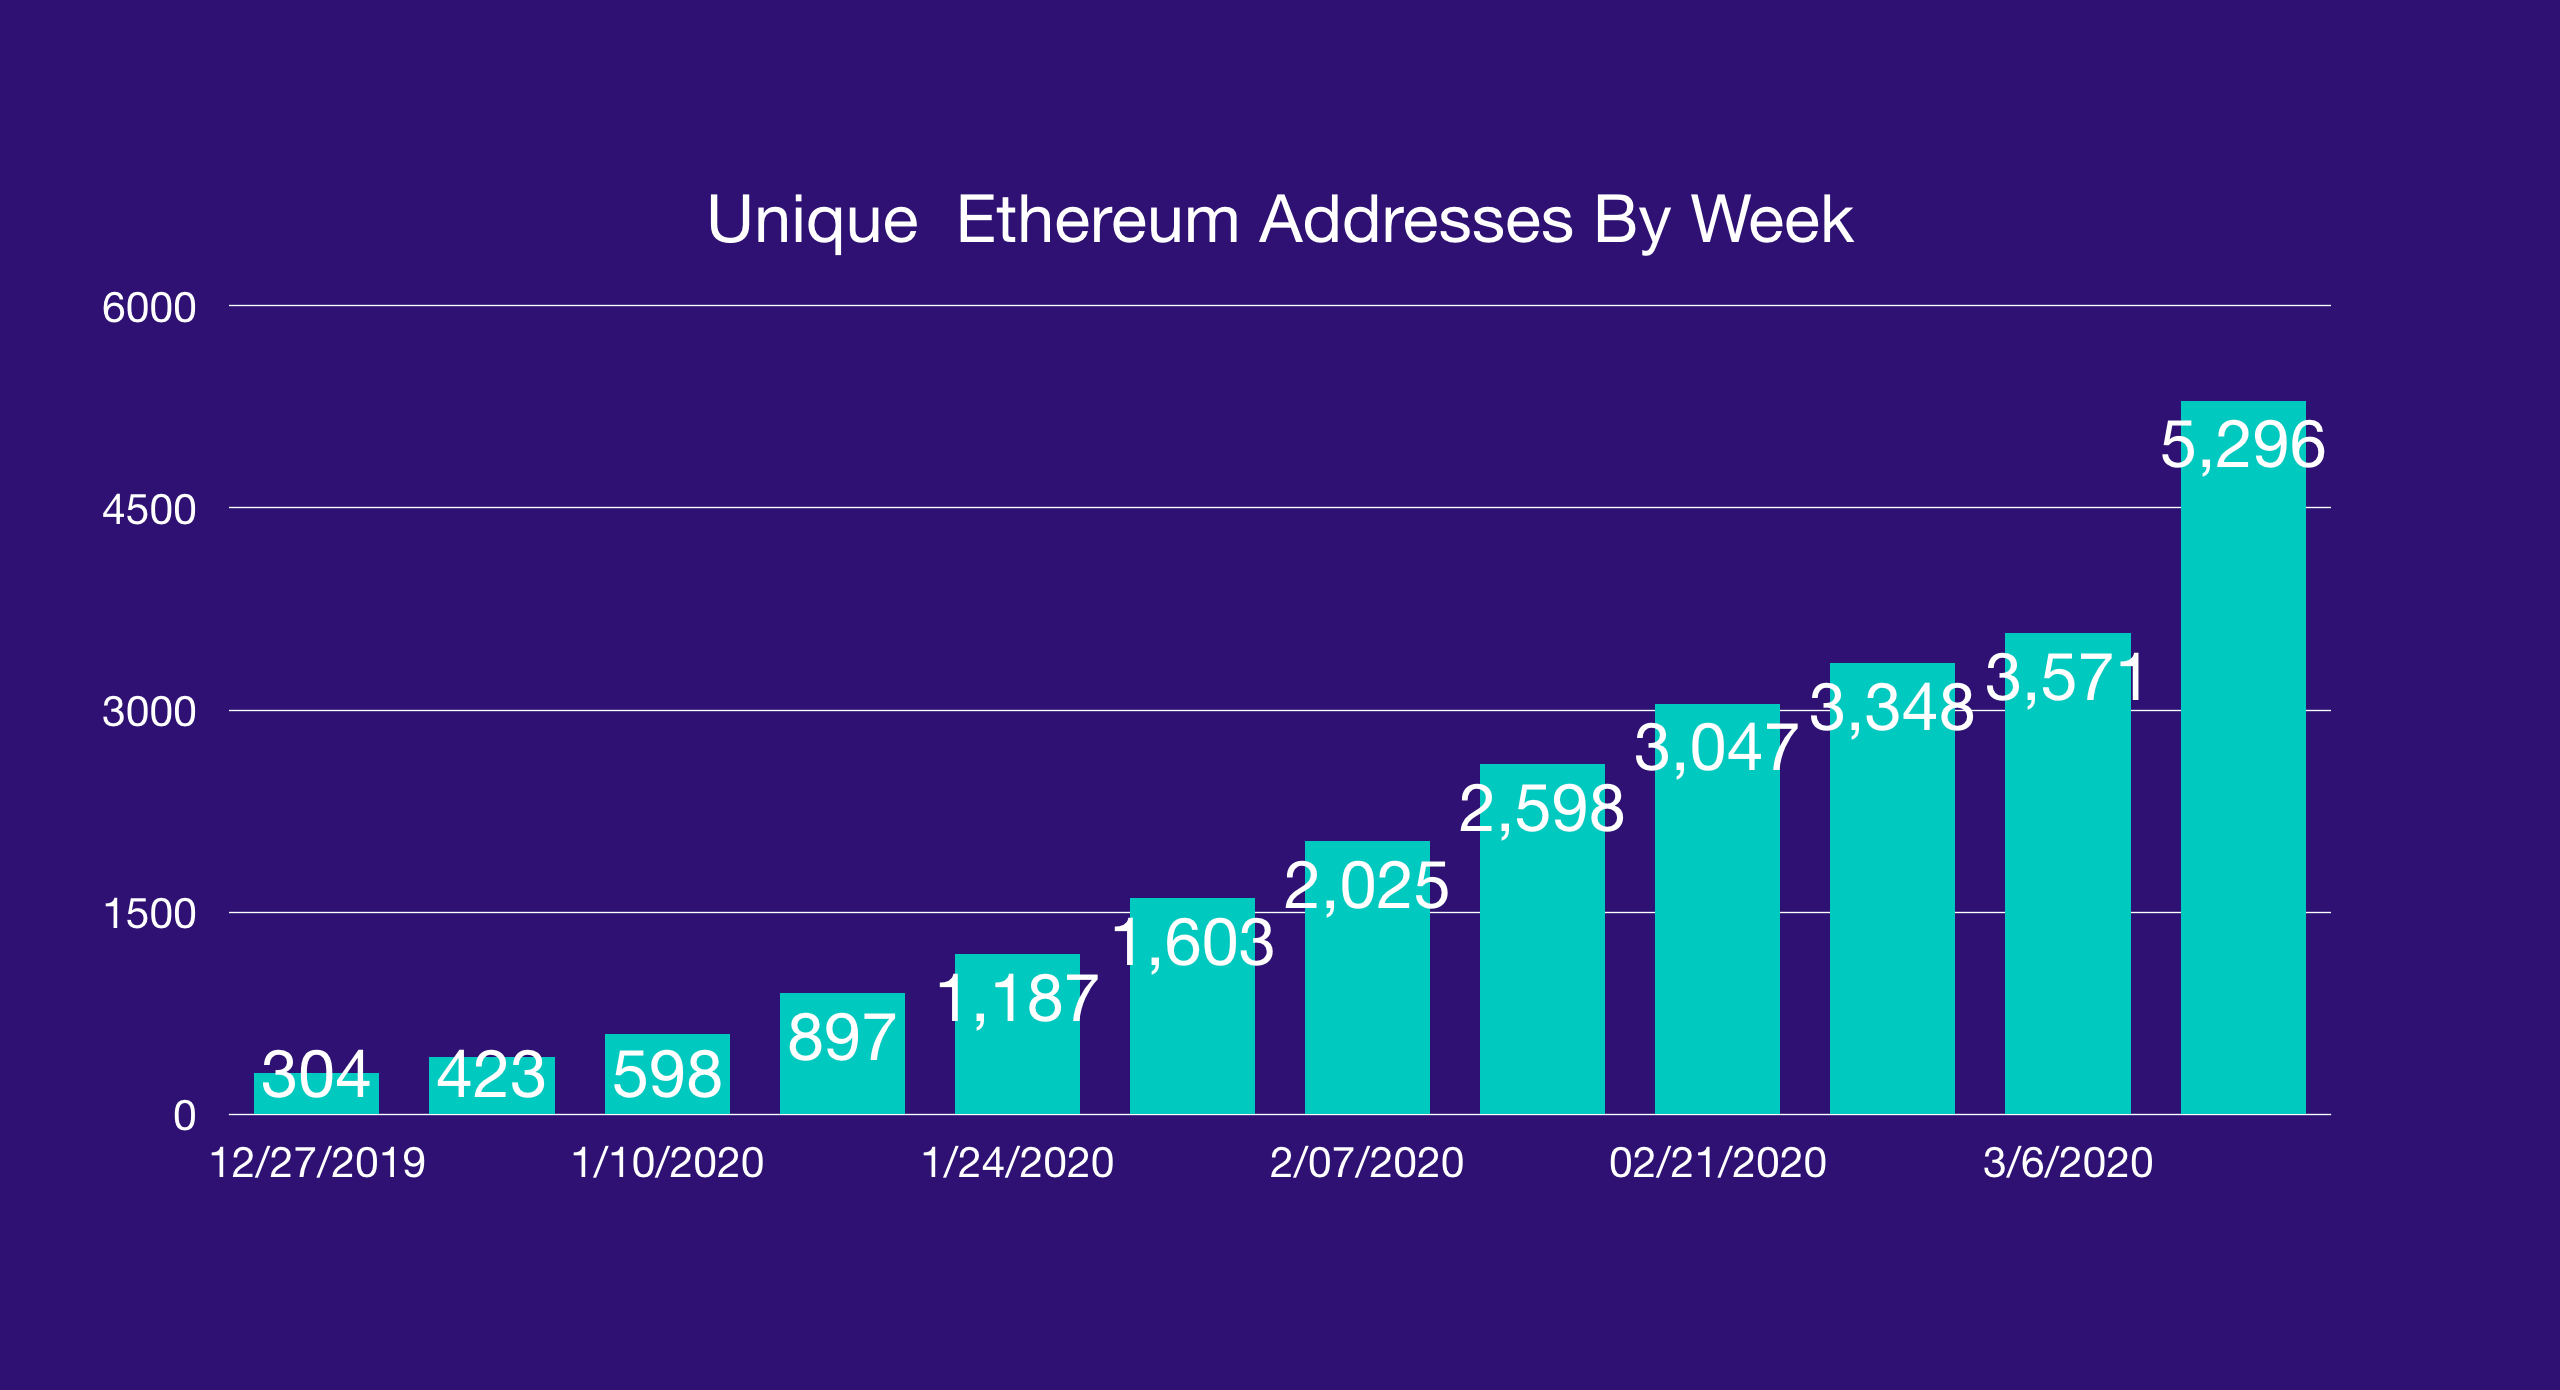
- One way to measure the overall health of the protocol is relative to other parts of the ecosystem. PoolTogether is built on top of Compound Finance. Compound Finance currently has 5,489 unique Dai suppliers (addresses) through their interface and PoolTogether has 5,296, meaning there is almost more people supplying Dai through PoolTogether to Compound than to Compound directly.
Contributor: Deniz Omer, Head of Ecosystem Growth at Kyber
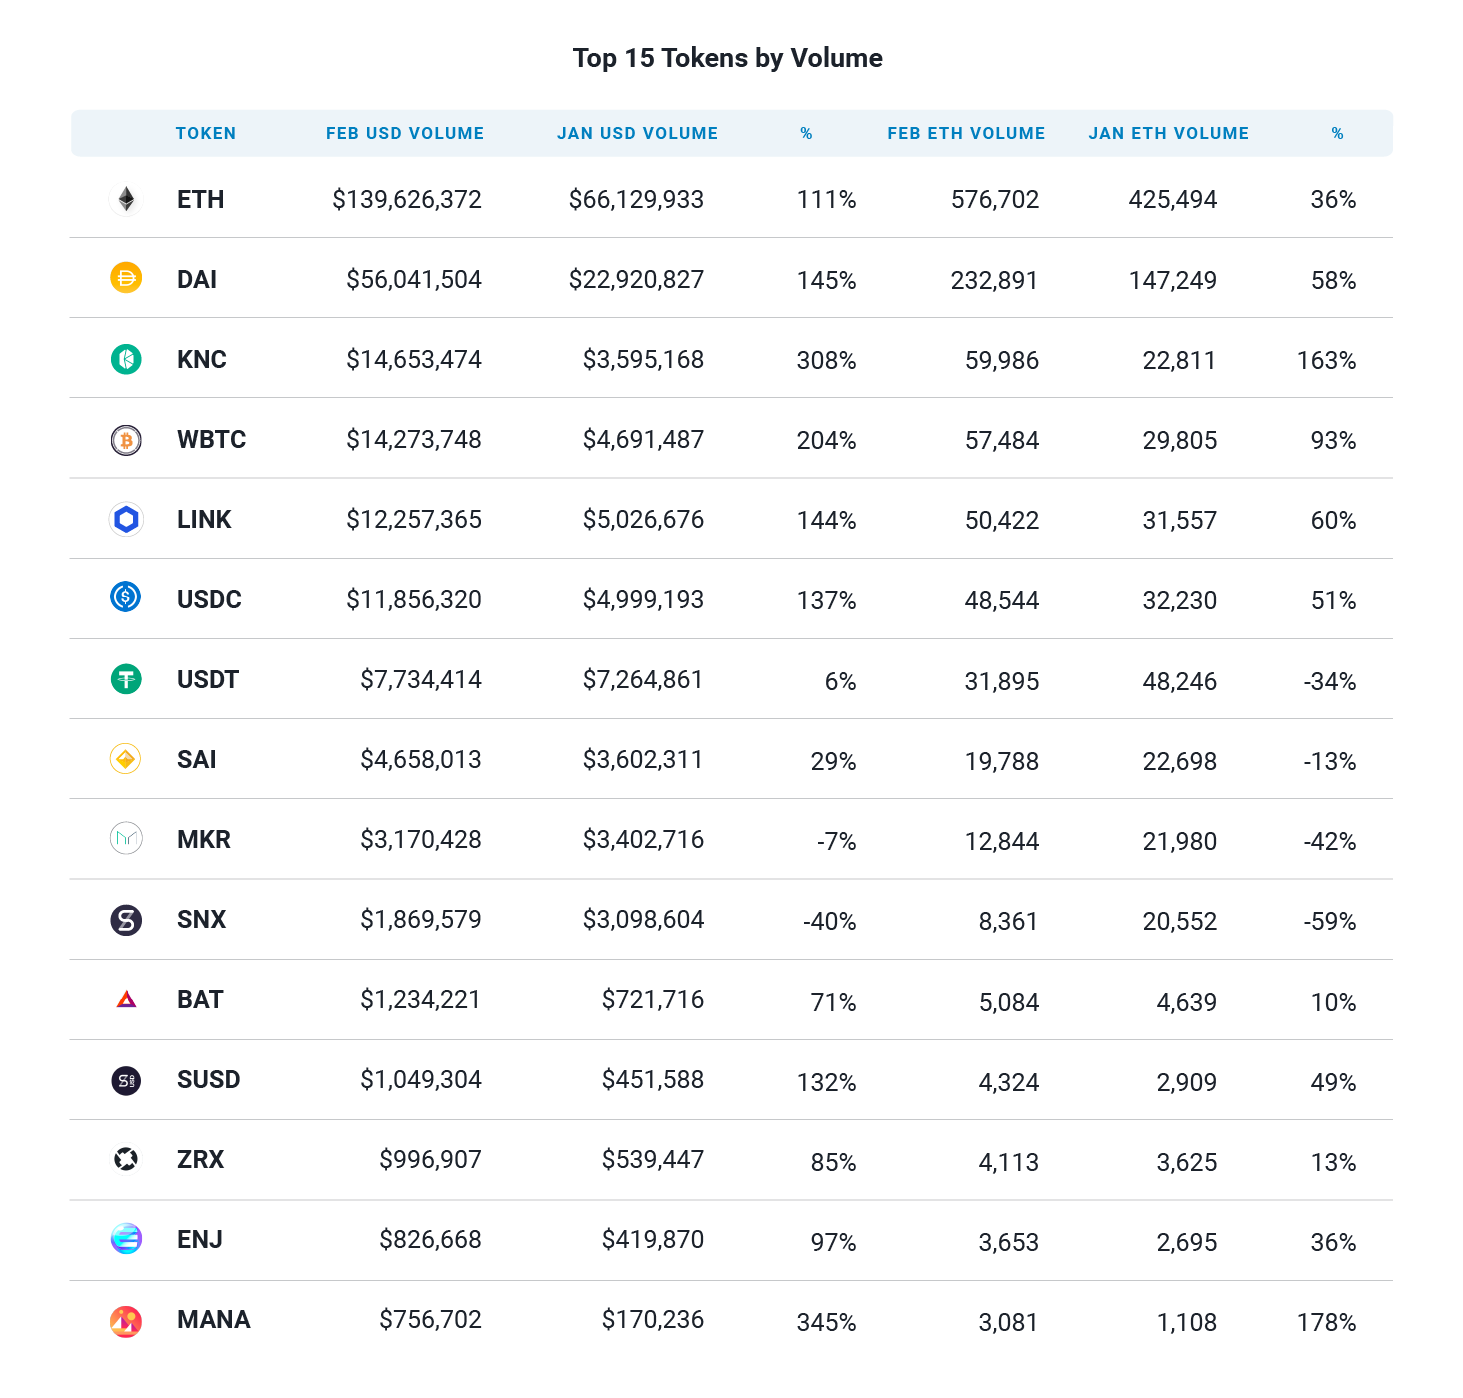
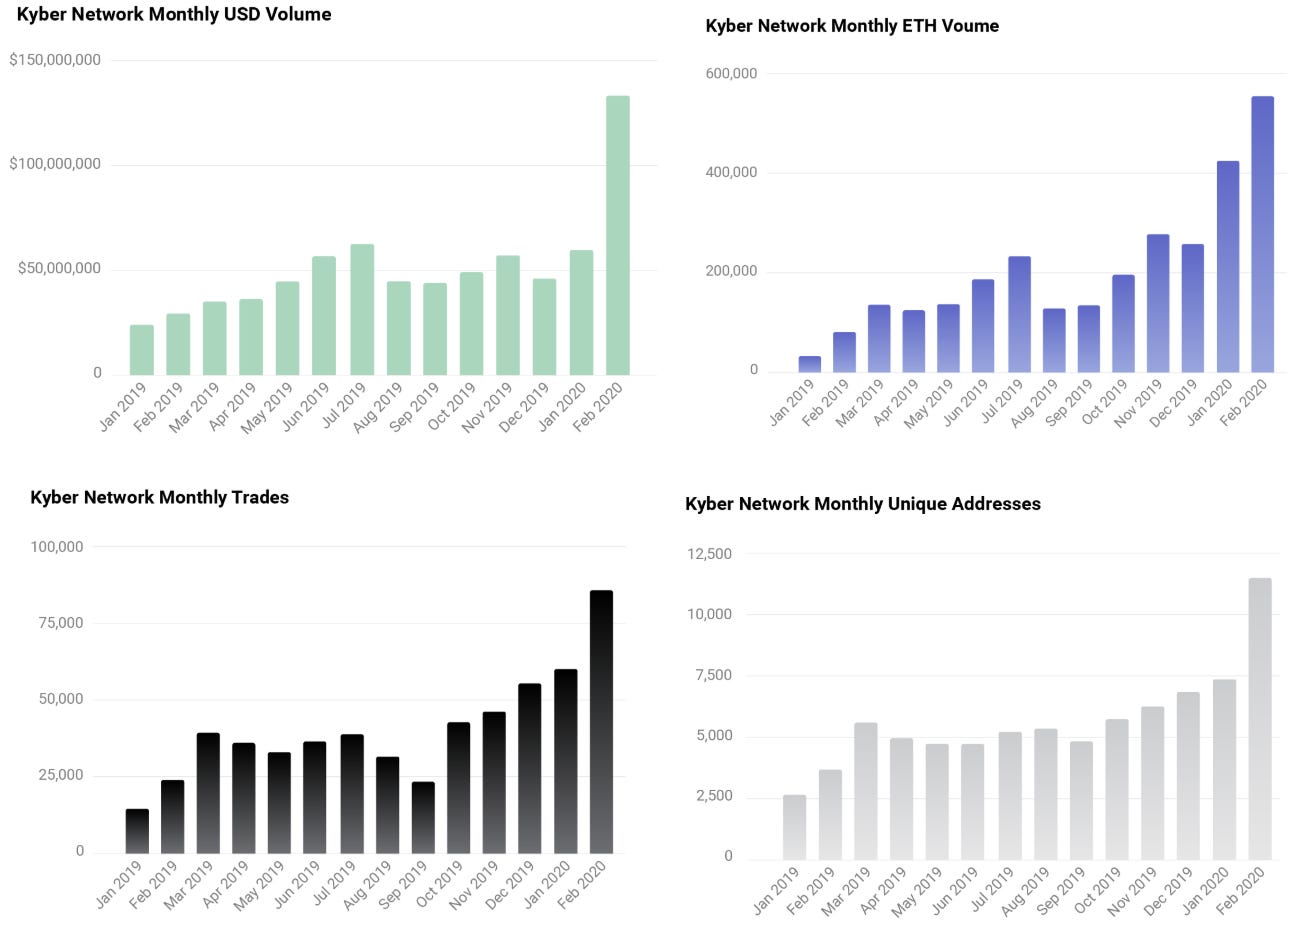
- Kyber had its best month on record in February as it reached new monthly and daily volume records and achieved its all time highest number of users and number of new users in a month since launch. USD volume for February was $139,590,000 while on the 13th of the month it reached an ATH of $11M traded on a single day (subsequently broken again 10th of March with $14M traded in a day). Kyber has also averaged $6.9M daily volume over the last 7 days (vs $5.4M Uniswap, $4.3M 0x, $3.4M Oasis).
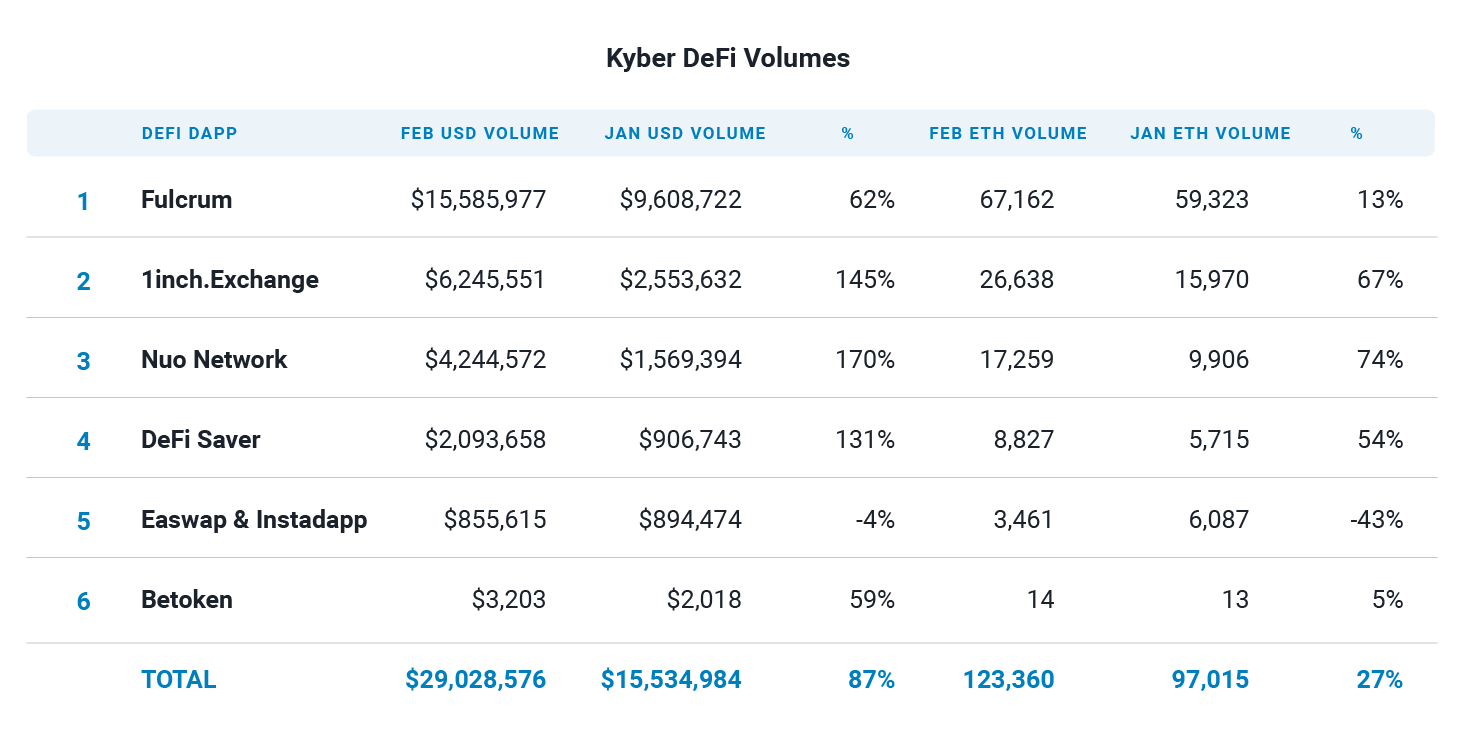
- DeFi dapps are showing continuing growth going into 2020 and many Kyber-integrated dapps have achieved double digit volume growth (for transactions passing through Kyber) from January to February. Fulcrum continues to be the largest DeFi integration and saw its February volume reach an impressive $15M despite some of the known difficulties faced by bZx.
- Looking at the Kyber reserves, we see a very healthy liquidity market that is scaling up as volumes scale up with 576,943 ETH traded over 85,024 transactions in February. Kyber’s own reserve makes up 38% of all volume by providing liquidity to over 44 tokens, while the Oasis Dex Bridge and Uniswap Dex Bridge accounted for a quarter and a tenth of total volumes respectively.
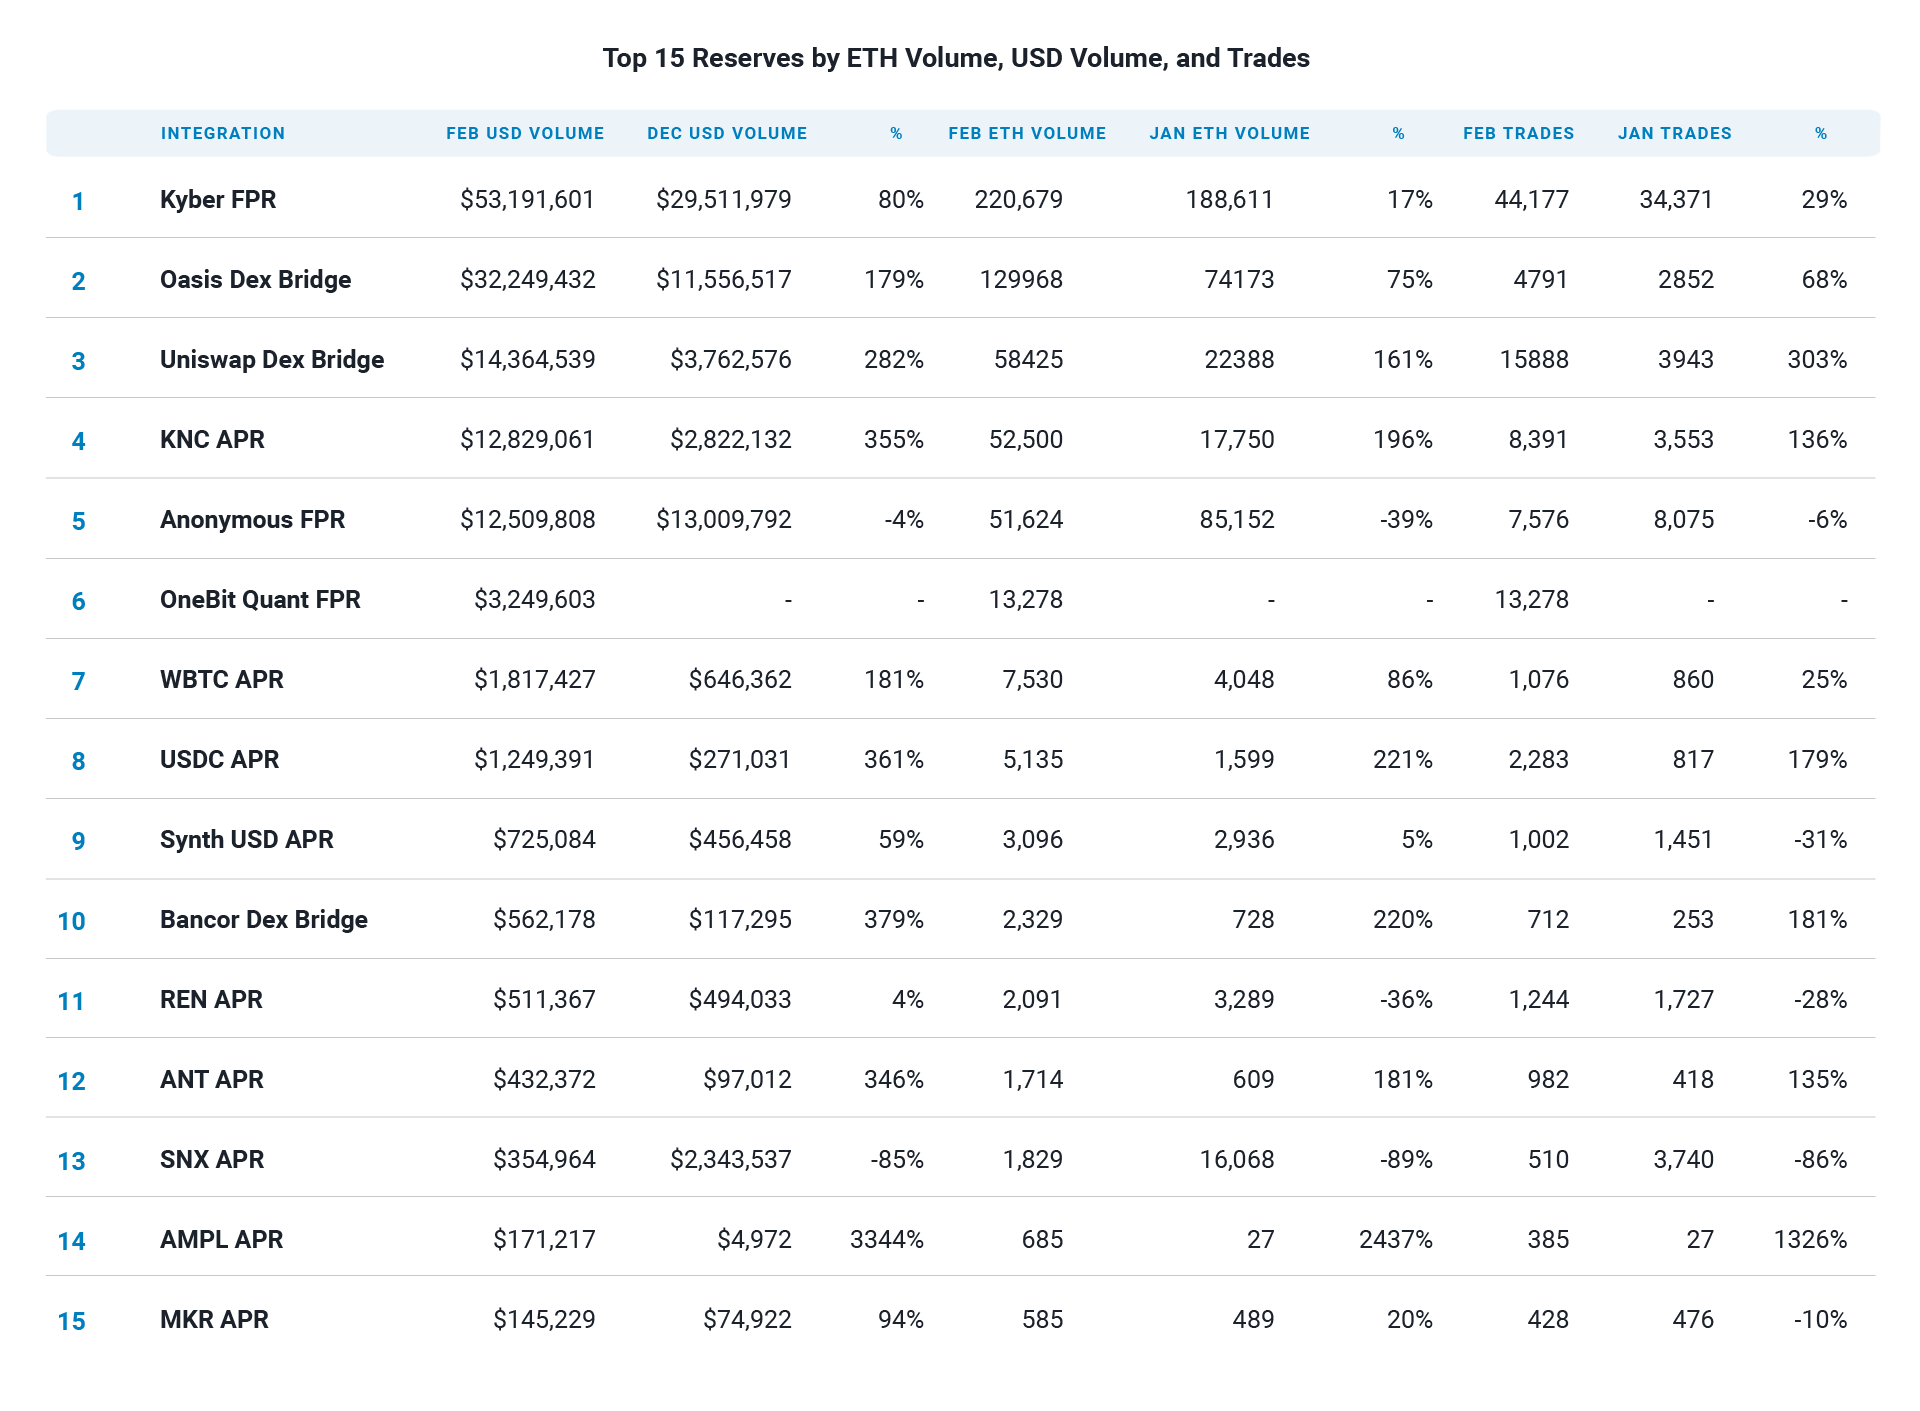
- The most popular token traded on Kyber continues to be DAI by a significant margin. Oasis shows its DAI price competitiveness by fulfilling 62% of all DAI volume ($32M) vs 22% fulfilled by the Kyber reserve ($11M) and 10% for Uniswap ($5M). Out of all tokens available on Kyber Network, KNC has seen the largest increase in volume by jumping from $3.6M volume in January, to $14.7M in February, followed closely by WBTC with $14.3M volume.